Your cart is currently empty!
Author: admin
-
Seedance 2.0: ByteDance’s AI Video Generator, Complete Guide for Developers & Creators
On February 10, 2026, ByteDance dropped a bombshell on the AI video generation space. Seedance 2.0,their next-generation multimodal video model,can turn a simple text prompt into a cinematic, multi-shot video with synchronized audio in under 60 seconds. And it costs less than $10/month.
Within days, Seedance 2.0 videos flooded social media. A clip of “Tom Cruise” fighting “Brad Pitt” on a rooftop went viral. Hollywood responded with cease-and-desist letters. Google Trends showed +50% search spikes for “seedance ai 2.0” and “seedance bytedance.” The AI video generation market will never be the same.
Whether you are a developer looking to integrate AI video generation into your product, a content creator exploring new tools, or simply curious about what ByteDance built,this guide covers everything. We will walk through the features, show you how to use it step by step, provide production-ready Python code for the API, compare it against Sora 2 and Kling 3.0, break down the pricing, and address the controversy.
Let’s dive in.
What Is Seedance 2.0?
Seedance 2.0 is ByteDance’s latest AI video generation model built on a unified multimodal audio-video joint generation architecture. Unlike previous models that handled text, images, and audio separately, Seedance 2.0 processes all four modalities,text, images, video clips, and audio,simultaneously in a single generation pass.
The result? You can upload a character photo, a reference dance video, a background music track, and a text prompt describing the scene,and Seedance 2.0 produces a coherent, multi-shot video with lip-synced dialogue, matching background music, and consistent character appearance throughout.
Key facts at a glance:
Detail Specification Developer ByteDance (Seed Team) Release date February 10, 2026 Architecture Diffusion Transformer (multimodal) Max resolution 2K (up to 1080p via API) Video duration 4–15 seconds per generation Generation time 30–120 seconds Input types Text, images, video, audio (up to 12 files) Audio Native generation with lip sync Aspect ratios 16:9, 9:16, 4:3, 3:4, 1:1, 21:9 Platform Dreamina (Jimeng), CapCut, Volcengine API launch February 24, 2026 (official via Volcengine) Pricing From ~$9.60/month (Jimeng Standard) The Evolution: From Seedance 1.0 to 2.0
Seedance did not appear out of nowhere. ByteDance’s Seed Team spent roughly 8 months evolving from a research paper to the most capable AI video model in the world. Understanding this evolution helps you appreciate what 2.0 actually changed.
Timeline
Version Date Key Milestone Seedance 1.0 June 2025 Research paper submitted to arXiv by 44 researchers. Text-to-video only, 5–8 second silent clips. Seedance 1.5 Late 2025 Added limited image reference and basic audio sync. Available on Jimeng platform in China. Seedance 2.0 February 10, 2026 Full multimodal architecture. 12-file input, native audio, multi-shot narratives, up to 15 seconds. What Changed at Each Stage
Video Length & Coherence
Seedance 1.0 topped out at roughly 5–8 seconds of coherent video before temporal consistency broke down. Version 1.5 pushed this to ~10 seconds. Seedance 2.0 generates up to 15 seconds while maintaining character consistency, logical scene flow, and physical accuracy throughout the entire clip.
Motion & Physics
Version 1.0 produced basic motion but struggled with complex interactions,objects would clip through each other, gravity was inconsistent, and fabric looked painted on. Seedance 2.0 incorporates physics-aware training objectives that penalize implausible motion. The result: gravity works, fabrics drape correctly, fluids behave like fluids, and object interactions look substantially more believable. The model can now generate multi-participant competitive sports scenes,something previous versions could not handle.
Input Capabilities
This is where the leap is most dramatic:
Capability 1.0 1.5 2.0 Text prompts Yes Yes Yes Image references No Limited (1–2) Up to 9 Video references No No Up to 3 Audio references No No Up to 3 Total file limit 0 1–2 12 @ Reference system No No Yes Audio Integration
Version 1.0 was completely silent. Version 1.5 could synchronize audio with major visual events but missed fine details,footstep timing was off, ambient sounds did not match the scene. Seedance 2.0 captures nuances: clothing rustling sounds vary with the fabric type visible in video, environmental acoustics match spatial characteristics, and music responds not just to action intensity but to subtle emotional beats conveyed through visual performance.
Controllability
Seedance 1.5 gave you a text box and hoped for the best. Seedance 2.0 puts you in the director’s chair,you control character appearance, camera movement, choreography, audio, and editing rhythm independently through the @ reference system. The model’s instruction-following and consistency performance are fully upgraded, enabling anyone to command the video creation process without professional training.
What Makes Seedance 2.0 Different?
The AI video generation space already has strong players,OpenAI’s Sora 2, Google’s Veo 3.1, Runway Gen-4, and Kuaishou’s Kling 3.0. So what makes Seedance 2.0 stand out?
1. Multimodal 12-File Input System
This is the headline feature. Seedance 2.0 is the only model that accepts up to 12 reference files simultaneously across four modalities:
Input Type Maximum Purpose Images Up to 9 Character appearance, scene setting, style reference Video clips Up to 3 (15s combined) Motion reference, camera work, choreography Audio files Up to 3 MP3s (15s combined) Background music, ambient sounds, timing Text prompt Natural language Scene description, narrative direction No other model comes close to this level of multimodal control. Sora 2 accepts text and a single image. Kling 3.0 supports text and image. Seedance 2.0 lets you orchestrate an entire production with multiple reference assets.
2. The @ Reference System
When you upload files, Seedance 2.0 assigns each one a label,
@Image1,@Video1,@Audio1,and you reference them directly in your text prompt. This gives you precise control over how each asset is used:Use @Image1 as the main character's appearance. Follow the camera movement from @Video1. Apply the choreography from @Video2 to the character. Use @Audio1 for background music. The character walks through a neon-lit Tokyo street at night, rain reflecting city lights on the pavement.This is a game-changer for creators who want precision rather than hoping the AI interprets their vision correctly.
3. Native Audio Generation
Previous video generation models produced silent clips. Seedance 2.0 generates synchronized audio natively:
- Dialogue with lip sync,Characters speak with accurately synced mouth movements
- Background music,Automatically generated or matched to uploaded audio
- Ambient sound effects,Environmental audio that matches the visual scene
- Beat synchronization,Video cuts and motion timed to the music rhythm
Note: ByteDance suspended the voice-from-photo feature on February 10 after concerns about generating voices without consent. The dialogue feature now requires explicit audio input.
4. Multi-Shot Storytelling
Single-clip generation is table stakes in 2026. Seedance 2.0’s real power is multi-shot narrative generation:
- Character consistency,The same character maintains their appearance across multiple shots and camera angles
- Natural camera transitions,Wide shot to close-up, tracking shots, dolly movements
- Logical story flow,Scenes connect narratively, not just visually
- Logo and text preservation,Brand elements stay intact throughout the sequence
5. Physics and Motion Quality
Seedance 2.0 shows significant improvements in physical realism:
- Objects interact with realistic physics (gravity, collisions, fluid dynamics)
- Human motion is natural,walking, running, dancing, fighting
- Fabric drapes and moves realistically
- Lighting responds correctly to scene changes
- No more “melting faces” or “extra fingers” (mostly)
How to Access Seedance 2.0: 3 Methods
As of February 2026, there are three ways to use Seedance 2.0:
Method 1: Dreamina (Jimeng),Primary Platform
Dreamina (known as Jimeng in China) is ByteDance’s creative AI platform and the primary way to access Seedance 2.0.
- Go to dreamina.capcut.com
- Sign up using Google, TikTok, Facebook, CapCut, or email
- Navigate to the AI Video Generator tool
- Select Seedance 2.0 as the model
- Upload your reference files and write your prompt
- Hit generate,results arrive in 30–120 seconds
Pricing: New users can start with a 1 RMB (~$0.14) trial. Daily free login points allow limited free generation. The Standard membership is approximately $9.60/month.
Method 2: Volcengine (BytePlus),Enterprise & API
Volcengine is ByteDance’s cloud platform (similar to AWS). It offers enterprise-level access with a workstation interface for testing. The official REST API launches February 24, 2026 through Volcengine and BytePlus.
Method 3: Third-Party API Aggregators,For Developers Now
If you cannot wait for the official API, several third-party platforms already offer Seedance 2.0 endpoints through OpenAI-compatible interfaces. These include platforms like Apiyi, Kie AI, and Atlas Cloud. The benefit: your integration code will require minimal changes when the official API launches.
Method 4: Little Skylark (Xiaoyunque),Free Unlimited Access
This is the hidden gem that is trending +4,650% on Google right now. Little Skylark (小云雀 / Xiaoyunque) is a separate ByteDance creative app that currently offers zero-point deduction for Seedance 2.0 generation,meaning unlimited free videos during the promotional period.
How to set it up:
- Download the Little Skylark (Xiaoyunque) app from iOS App Store or Google Play
- Create an account,new users receive 3 free Seedance 2.0 generations immediately upon login
- You also receive 120 free points every day just by logging in
- Navigate to the AI video section and select Seedance 2.0
- Generate videos at no cost during the current promotional period
Little Skylark vs Dreamina:
Feature Little Skylark Dreamina Free generations 3 on signup + 120 daily points (currently unlimited) Limited daily login points Seedance 2.0 cost 0 points (promotional) Points deducted per generation Platform iOS & Android app Web + iOS + Android Language Primarily Chinese (use browser translation) English, Chinese, Japanese, others Best for Free experimentation and testing Production use and English UI Note: The free promotional period may end without notice. If you want to experiment with Seedance 2.0 before committing to a paid plan, Little Skylark is currently the best option.
Method 5: ChatCut,AI Video Editing + Seedance Generation
ChatCut is an autonomous AI video editing agent that has exploded in popularity alongside Seedance 2.0,trending at +4,700% on Google. It does not just generate video; it edits video using natural language commands, and it can call Seedance 2.0 as an integrated tool.
What makes ChatCut + Seedance powerful:
- Natural language editing,Tell ChatCut “remove the awkward pause at 0:03” or “speed up the middle section” and it executes the edit automatically
- Seedance as a tool,ChatCut can call Seedance 2.0 to generate new clips, then seamlessly integrate them into your existing edit
- The “Nano Banana” pipeline,A popular community trick: use an image generator (like Nano Banana) to create a high-quality starting frame, then feed it into Seedance 2.0 through ChatCut for superior results
- End-to-end workflow,Generate → edit → refine → export, all through natural language prompts without switching tools
How to use it:
- Go to chatcut.io and sign up
- Upload existing footage or use Seedance 2.0 to generate new clips
- Use natural language commands to edit:
"Cut to the beat of the music","Remove repeated takes","Restructure for a 30-second Instagram Reel" - ChatCut orchestrates Seedance generation and editing autonomously
- Export the final video
If you need to go from raw idea to polished, edited video without learning traditional editing software, the ChatCut + Seedance combination is currently the fastest path.
Step-by-Step Tutorial: Creating Your First Seedance 2.0 Video
Let’s walk through creating a video from scratch using Dreamina.
Step 1: Set Up Your Workspace
After signing in to Dreamina, select the Seedance 2.0 video generator. You will see three areas: the file upload panel (left), the prompt editor (center), and the settings panel (right).
Step 2: Upload Your Reference Assets
Upload the files you want the AI to reference. Each file gets an automatic label:
- Upload a character photo → labeled
@Image1 - Upload a dance reference video → labeled
@Video1 - Upload background music → labeled
@Audio1
Pro tip: Prioritize your most important assets. The model pays more attention to files explicitly referenced in the prompt.
Step 3: Write Your Prompt Using @ References
This is where the magic happens. Reference your uploaded files directly in the prompt:
@Image1 as the main character. She is standing on a rooftop
overlooking a futuristic city at sunset. Apply the dance moves
from @Video1 as she begins to dance. Background music from
@Audio1. Camera slowly orbits around her. Cinematic lighting,
lens flare, 4K quality.
Step 4: Configure Generation Settings
Setting Recommended Value Notes Duration 8 seconds Start short, extend later if needed Aspect ratio 16:9 Use 9:16 for TikTok/Reels, 1:1 for Instagram Resolution 1080p 2K available on Dreamina, 1080p via API Step 5: Generate and Iterate
Click Generate. The video typically appears in 30–120 seconds depending on complexity and resolution. If the result is not perfect:
- Refine your prompt,Be more specific about which file serves which purpose
- Use the extend feature,Add seconds to a clip you like:
"Extend @Video1 by 5 seconds" - Try different seeds,The same prompt produces different results with different seed values
- Adjust reference weights,Emphasize certain inputs over others
Common @ Reference Patterns
What You Want Prompt Pattern Set character appearance @Image1 as the main character's lookCopy camera movement Follow the camera motion from @Video1Replicate choreography Apply the dance moves from @Video1 to @Image1Set the first frame @Image1 as the first frameAdd background music Use @Audio1 for background musicExtend an existing video Extend @Video1 by 5 seconds, continue the sceneTransfer style Apply the visual style of @Image2 to the sceneManga-to-animation Animate @Image1 (manga page) into a scenePrompt Engineering Guide: Write Prompts That Actually Work
The difference between a mediocre Seedance 2.0 video and a cinematic one is almost always the prompt. After analyzing hundreds of successful generations, here is the formula that consistently produces the best results.
The Director’s Formula
Structure every prompt using this pattern:
Subject + Action + Camera + Scene + Style + Constraints
Subject: [who/what, age or material if relevant]
Action: [specific verb phrase, present tense]
Camera: [shot size] + [movement] + [angle], [focal length]
Style: [one visual anchor: film/process/artist], [lighting], [color]
Constraints: [what to exclude], [duration], [consistency notes]
Critical rule: Keep prompts between 30–100 words. The model performs best with concise, laser-focused prompts. Pushing beyond 100 words causes results to degrade noticeably.
Camera Vocabulary Seedance 2.0 Understands
Category Terms the Model Recognizes Shot sizes Wide, medium, close-up, extreme close-up, full body Movement Dolly in/out, track left/right, crane up/down, handheld, gimbal, orbit, push Speed Slow, medium, fast (pair with movement: “slow dolly in”) Angles Eye level, low angle, high angle, bird’s eye, Dutch angle Lens feel Wide (24-28mm), normal (35-50mm), telephoto (85mm+) Special Hitchcock zoom, speed ramp, rack focus, whip pan 5 Copy-Paste Ready Prompt Templates
Template 1: Product Ad (E-commerce)
Black matte mechanical keyboard on white infinite studio
background, rotating 360° clockwise. RGB lighting breathing
gently. Sharp keycap text. Macro camera, smooth turntable
motion. Commercial photography style. Soft high-key lighting,
no noise. 8 seconds.
Template 2: Cinematic Character Scene
18-year-old woman with short hair, white dress, straw hat on
a sunlit forest path. Slow turn toward camera with a gentle
smile. Light breeze moves hair and dress. Camera pushes from
medium to close-up. Soft natural lighting, film grain, warm
tones. Maintain face consistency, no distortion. 8 seconds.
Template 3: Action / Fight Scene
Wuxia hero in black martial outfit fighting enemies in rainy
bamboo forest at night. Fast sword combos with visible light
trails and splashing water. Follow camera with crane shots and
close-ups. Cinematic color grading. Character consistency
throughout. Realistic physics. 10 seconds.
Template 4: Music Video with Beat Sync
Cyberpunk woman dancing in neon city street at night. Strong
beats trigger cuts and speed-ramped moves. Neon signs reflecting
on wet ground. Fast-paced editing with multi-shot continuity.
Character appearance remains consistent across all shots.
Use @Audio1 for rhythm. 15 seconds.
Template 5: Multi-Shot Storytelling
Scene 1: Robot wakes in abandoned factory, looks around confused.
Scene 2: Robot walks outside to a sunset wasteland.
Scene 3: Robot discovers a small flower growing through cracked
concrete, gently touches it.
Scene 4: Robot looks up at the sky, smiling.
Robot appearance consistent across all scenes. Emotional
transition from confusion to warmth. Cinematic lighting. 15 seconds.
Negative Prompt Checklist
Add these to your constraints to avoid common artifacts:
No text overlays, no watermarks, no floating UI, no lens flares,
no extra characters, no mirrors, no snap zooms, no whip pans,
no extra fingers, no deformed hands, no logos, no recognizable
brands, no auto captions.
Strategy: Use 3–5 negatives per scene. Excessive bans can dull the imagery and reduce creative output.
Consistency Fix Language
If characters keep changing appearance between shots, add this to your prompt:
Same character, same clothing, same hairstyle, no face changes,
no flicker, high consistency.
Troubleshooting Decision Rules
Problem Fix Framing is wrong but action is right Re-prompt,only tighten the Camera line Motion looks unnatural Swap handheld ↔ gimbal; explicitly set speed Style keeps drifting Use one strong anchor reference, remove adjective clutter Subject mutates between shots Simplify character description to one noun + consistency fix Same artifacts repeating Change shot plan; step back to a wider shot The golden rule: Two fast re-prompts maximum. If it is still not working, shift strategy entirely rather than making incremental changes.
Developer Guide: Seedance 2.0 API Integration
For developers who want to integrate Seedance 2.0 video generation into their applications, here is the complete API integration guide with production-ready Python code.
API Overview
The Seedance 2.0 API follows a standard async task pattern:
- Submit a generation request → receive a
task_id - Poll the task status until it completes
- Download the generated video
API Endpoints
Capability Endpoint Method Text-to-Video /v2/generate/textPOST Image-to-Video /v2/generate/imagePOST Check Status /v2/tasks/{task_id}GET Download Result /v2/tasks/{task_id}/resultGET Webhook Config /v2/webhooksPOST Account Info /v2/accountGET Base URL:
https://api.seedance.aiStep 1: Install Dependencies
pip install requests python-dotenvStep 2: Set Up Authentication
import os
import time
import requests
from dotenv import load_dotenv

load_dotenv()

SEEDANCE_API_KEY = os.environ["SEEDANCE_API_KEY"]
BASE_URL = "https://api.seedance.ai"

headers = {
    "Authorization": f"Bearer {SEEDANCE_API_KEY}",
    "Content-Type": "application/json",
}
Important: Never hardcode API keys in source code. Always use environment variables or a secrets manager.
Step 3: Text-to-Video Generation
def generate_text_to_video(
    prompt: str,
    duration: int = 4,
    aspect_ratio: str = "16:9",
) -> str:
    """
    Submit a text-to-video generation request.
    Returns the task_id for status polling.
    """
    payload = {
        "model": "seedance-2.0",
        "prompt": prompt,
        "duration": duration,          # 4 or 8 seconds
        "aspect_ratio": aspect_ratio,  # "16:9", "9:16", "1:1"
    }

    response = requests.post(
        f"{BASE_URL}/v2/generate/text",
        headers=headers,
        json=payload,
    )
    response.raise_for_status()

    data = response.json()
    task_id = data.get("data", {}).get("task_id")

    if not task_id:
        error_msg = data.get("error", {}).get("message", "Unknown error")
        raise ValueError(f"Generation failed: {error_msg}")

    print(f"Task submitted: {task_id}")
    return task_id
Step 4: Image-to-Video Generation
import base64

def generate_image_to_video(
    image_path: str,
    prompt: str,
    duration: int = 4,
    aspect_ratio: str = "16:9",
) -> str:
    """
    Submit an image-to-video generation request.
    The image serves as the first frame or character reference.
    """
    with open(image_path, "rb") as f:
        image_base64 = base64.b64encode(f.read()).decode("utf-8")

    payload = {
        "model": "seedance-2.0",
        "prompt": prompt,
        "image": image_base64,
        "duration": duration,
        "aspect_ratio": aspect_ratio,
    }

    response = requests.post(
        f"{BASE_URL}/v2/generate/image",
        headers=headers,
        json=payload,
    )
    response.raise_for_status()

    data = response.json()
    task_id = data.get("data", {}).get("task_id")

    if not task_id:
        error_msg = data.get("error", {}).get("message", "Unknown error")
        raise ValueError(f"Generation failed: {error_msg}")

    print(f"Task submitted: {task_id}")
    return task_id
Step 5: Poll for Results
def poll_for_result(
    task_id: str,
    max_attempts: int = 60,
    interval: float = 3.0,
) -> str:
    """
    Poll the task status until completion.
    Returns the video URL when ready.
    """
    for attempt in range(max_attempts):
        response = requests.get(
            f"{BASE_URL}/v2/tasks/{task_id}",
            headers=headers,
        )
        response.raise_for_status()
        data = response.json()["data"]

        status = data["status"]
        print(f"  Attempt {attempt + 1}: {status}")

        if status == "completed":
            video_url = data["video_url"]
            print(f"Video ready: {video_url}")
            return video_url

        if status == "failed":
            error = data.get("error", "Unknown error")
            raise RuntimeError(f"Generation failed: {error}")

        time.sleep(interval)

    raise TimeoutError(
        f"Generation timed out after {max_attempts * interval}s"
    )
Step 6: Download the Video
def download_video(video_url: str, output_path: str = "output.mp4") -> str:
    """Download the generated video to a local file."""
    response = requests.get(video_url, stream=True)
    response.raise_for_status()

    with open(output_path, "wb") as f:
        for chunk in response.iter_content(chunk_size=8192):
            f.write(chunk)

    print(f"Video saved to {output_path}")
    return output_path
Complete Example: End-to-End Generation
def main():
    # Text-to-Video
    task_id = generate_text_to_video(
        prompt=(
            "A samurai standing in a bamboo forest at dawn. "
            "Mist rolls through the trees. He slowly unsheathes "
            "his katana. Cinematic lighting, shallow depth of field, "
            "8K quality."
        ),
        duration=8,
        aspect_ratio="16:9",
    )
    video_url = poll_for_result(task_id)
    download_video(video_url, "samurai_scene.mp4")

    # Image-to-Video
    task_id = generate_image_to_video(
        image_path="character_photo.png",
        prompt=(
            "The character walks through a neon-lit city street "
            "at night. Rain falls gently. Camera follows from behind "
            "then circles to a front-facing close-up."
        ),
        duration=8,
        aspect_ratio="16:9",
    )
    video_url = poll_for_result(task_id)
    download_video(video_url, "neon_city_scene.mp4")

if __name__ == "__main__":
    main()
Handling Rate Limits
The API returns rate limit information in response headers:
def check_rate_limits(response: requests.Response) -> None:
    """Log rate limit status from response headers."""
    limit = response.headers.get("X-RateLimit-Limit")
    remaining = response.headers.get("X-RateLimit-Remaining")
    reset = response.headers.get("X-RateLimit-Reset")

    if remaining and int(remaining) < 5:
        print(f"WARNING: Only {remaining}/{limit} requests remaining. "
              f"Resets at {reset}")
API Rate Limits by Plan
Plan Concurrent Requests Requests/Minute Daily Limit Free 2 10 5 generations Pro 10 60 100 generations Business 50+ Custom Unlimited Request Parameters Reference
Parameter Type Required Description modelstring Yes Always "seedance-2.0"promptstring Yes 30–500 characters describing the scene imagestring Image-to-Video only Base64-encoded image aspect_ratiostring No "16:9","9:16","1:1","4:3","3:4","21:9"durationinteger No 4or8seconds (default: 4)seedinteger No For reproducible results Node.js / Next.js Integration
If your stack is JavaScript or TypeScript, here is how to integrate Seedance 2.0 into a Next.js application using a Server Action and an API route handler.
Next.js API Route Handler
// app/api/generate-video/route.ts
import { NextRequest, NextResponse } from "next/server";

const SEEDANCE_API_KEY = process.env.SEEDANCE_API_KEY!;
const BASE_URL = "https://api.seedance.ai";

const headers = {
  Authorization: `Bearer ${SEEDANCE_API_KEY}`,
  "Content-Type": "application/json",
};

export async function POST(request: NextRequest) {
  const { prompt, duration = 4, aspectRatio = "16:9" } = await request.json();

  if (!prompt || prompt.length < 30) {
    return NextResponse.json(
      { error: "Prompt must be at least 30 characters" },
      { status: 400 }
    );
  }

  // Step 1: Submit generation request
  const generateRes = await fetch(`${BASE_URL}/v2/generate/text`, {
    method: "POST",
    headers,
    body: JSON.stringify({
      model: "seedance-2.0",
      prompt,
      duration,
      aspect_ratio: aspectRatio,
    }),
  });

  if (!generateRes.ok) {
    const error = await generateRes.json();
    return NextResponse.json(
      { error: error.error?.message || "Generation failed" },
      { status: generateRes.status }
    );
  }

  const { data } = await generateRes.json();
  const taskId = data.task_id;

  // Step 2: Poll for result
  const videoUrl = await pollForResult(taskId);

  return NextResponse.json({ videoUrl, taskId });
}

async function pollForResult(
  taskId: string,
  maxAttempts = 60,
  interval = 3000
): Promise<string> {
  for (let i = 0; i < maxAttempts; i++) {
    const res = await fetch(`${BASE_URL}/v2/tasks/${taskId}`, { headers });
    const { data } = await res.json();

    if (data.status === "completed") return data.video_url;
    if (data.status === "failed") throw new Error(data.error || "Failed");

    await new Promise((resolve) => setTimeout(resolve, interval));
  }
  throw new Error("Generation timed out");
}
React Client Component
// components/video-generator.tsx
"use client";

import { useState } from "react";

export function VideoGenerator() {
  const [prompt, setPrompt] = useState("");
  const [videoUrl, setVideoUrl] = useState<string | null>(null);
  const [loading, setLoading] = useState(false);
  const [error, setError] = useState<string | null>(null);

  async function handleGenerate() {
    setLoading(true);
    setError(null);
    setVideoUrl(null);

    try {
      const res = await fetch("/api/generate-video", {
        method: "POST",
        headers: { "Content-Type": "application/json" },
        body: JSON.stringify({
          prompt,
          duration: 8,
          aspectRatio: "16:9",
        }),
      });

      if (!res.ok) {
        const data = await res.json();
        throw new Error(data.error || "Generation failed");
      }

      const { videoUrl } = await res.json();
      setVideoUrl(videoUrl);
    } catch (err) {
      setError(err instanceof Error ? err.message : "Something went wrong");
    } finally {
      setLoading(false);
    }
  }

  return (
    <div>
      <textarea
        value={prompt}
        onChange={(e) => setPrompt(e.target.value)}
        placeholder="Describe your video scene (30-500 characters)..."
        rows={4}
      />
      <button onClick={handleGenerate} disabled={loading}>
        {loading ? "Generating (30-120s)..." : "Generate Video"}
      </button>

      {error && <p style={{ color: "red" }}>{error}</p>}

      {videoUrl && (
        <video src={videoUrl} controls autoPlay loop width="100%" />
      )}
    </div>
  );
}
Environment Setup
# .env.local
SEEDANCE_API_KEY=your_api_key_here
This gives you a working Seedance 2.0 integration in any Next.js app. The API route handles authentication server-side (keeping your key safe), while the client component provides a simple UI. Extend this with image upload for image-to-video, webhook support for production, and a queue system for handling multiple concurrent generations.
Seedance 2.0 vs Sora 2 vs Kling 3.0 vs Runway Gen-4: Complete Comparison
February 2026 is a pivotal moment for AI video generation. Here is how the four leading models compare:
Feature Seedance 2.0 Sora 2 Kling 3.0 Runway Gen-4 Developer ByteDance OpenAI Kuaishou Runway Release Feb 10, 2026 Dec 2025 Feb 4, 2026 Jan 2026 Max resolution 2K 1080p 4K / 60fps 1080p Max duration 15 seconds 25 seconds 2 minutes 10 seconds Multimodal inputs 12 files (text + image + video + audio) Text + 1 image Text + 1 image Text + 1 image Native audio Yes (dialogue + music + SFX) No Limited No Character consistency Excellent Good Good Good Physics accuracy Good Excellent Good Fair Motion quality Excellent (reference-based) Excellent Good Good API available Feb 24, 2026 Yes Yes Yes Pricing ~$9.60/month $200/month (ChatGPT Pro) Free tier available $12/month+ Best for Multimodal control & precision Physics & realism Long-form & 4K quality Quick iterations Which Model Should You Choose?
Choose Seedance 2.0 if you need precision and control. When a client says “make this character move exactly like this reference video, with this specific music”,Seedance is the only model that can do it. The 12-file multimodal input is unmatched.
Choose Sora 2 if you need realistic physics and temporal consistency. For B-roll footage, documentary-style content, or any scene requiring complex light interactions and physical accuracy, Sora 2 remains the leader.
Choose Kling 3.0 if you need duration or resolution. At 2 minutes per generation and native 4K/60fps, Kling wins on output specs. Great for character-driven action sequences.
Choose Runway Gen-4 if you need fast iteration on a budget. The established API infrastructure, reasonable pricing, and consistent improvements make it reliable for production workflows.
The Industry Shockwave: How Seedance 2.0 Is Collapsing Costs
Seedance 2.0 is not just a new AI toy. It is triggering what analysts are calling a “cost collapse” across four major industries. The economics of video production are being rewritten in real time.
E-Commerce: The Photography Studio Killer
This is where the disruption is most immediate. Low-end video outsourcing firms and product photography studios that previously survived on technical barriers and information asymmetry now face a harsh winter. What used to require a studio, lighting rig, camera operator, and editor can now be done by a single merchant typing a prompt.
- Before Seedance: A 15-second product video costs $500–$5,000 from a production house, takes 3–7 days
- After Seedance: Same video costs ~$0.10 via API, takes 60 seconds
- Impact: Video production is shifting from professional outsourcing to routine in-house operations. Merchants on Taobao, Shopify, and Amazon can now generate product videos at scale.
Gaming: Concept-to-Trailer in Minutes
The costs of world-building, proof-of-concept, and paid user acquisition materials are decreasing exponentially. Game studios are using Seedance 2.0 to:
- Generate cinematic trailer concepts from character art before committing to full 3D production
- Create user acquisition ad creatives at scale (test 100 video ads instead of 5)
- Validate game concepts earlier in the pipeline and eliminate losers faster
- Prototype cutscenes and narrative sequences without involving the animation team
Internal testing has already begun at major studios. More projects can now be validated and eliminated at earlier stages, reducing wasted development budgets.
Film & Television: The Post-Production Revolution
Seedance 2.0’s multi-shot narrative capability is reshaping production workflows:
- Physical set construction is increasingly replaced by low-cost AI-generated environments
- Editing happens during generation, not in post-production. The multi-shot system effectively completes editing simultaneously with video creation.
- Pre-visualization that used to take weeks can now be done in hours
- Traditional editors are transitioning into “prompt engineers” and aesthetic gatekeepers
The “Content Inflation” Prediction
Industry analysts predict that the cost of producing generic video content will gradually converge toward marginal compute costs. This means:
- The content industry faces unprecedented inflation in supply (not prices)
- Traditional organizational structures and production workflows will be thoroughly restructured
- Paradoxically, this amplifies the value of authentic IP. As AI-generated content floods markets, original intellectual property becomes increasingly scarce and valuable.
- The winners will not be those who produce the most video, but those who produce the most meaningful video
The bottom line: If your business model depends on producing generic video content, Seedance 2.0 is an existential threat. If your business model depends on strategy, creativity, and original IP, it is a superpower.
Pricing Breakdown
Dreamina (Consumer Access)
Plan Price Includes Free Trial 1 RMB (~$0.14) Limited trial access to Seedance 2.0 Daily Free Points $0 (login required) A few generations per day Standard Membership ~$9.60/month (69 RMB) Full Seedance 2.0 access, 4–15s videos Dreamina Pro $18–$84/month Credit-based system with higher limits API Pricing (Estimated)
Resolution Estimated Cost 480p ~$0.10 per minute of video 720p ~$0.30 per minute of video 1080p ~$0.80 per minute of video Official API pricing will be confirmed when the Volcengine API launches on February 24, 2026.
Cost Comparison: Generating a 1-Minute Video at 1080p
Model Approximate Cost Seedance 2.0 ~$0.80 (API) or included in $9.60/mo subscription Sora 2 ~$200/month (ChatGPT Pro subscription required) Kling 3.0 Free tier available, paid plans vary Runway Gen-4 ~$12–$76/month depending on credits The takeaway: Seedance 2.0 is among the most affordable options in the market, especially considering its multimodal capabilities. At ~$9.60/month vs Sora 2’s $200/month, the price-to-feature ratio is exceptional.
The Hollywood Controversy: What You Need to Know
Seedance 2.0’s launch was immediately overshadowed by a massive copyright backlash.
What Happened
Within hours of launch, users began generating videos featuring recognizable Hollywood characters and celebrities. A viral clip showing “Tom Cruise” fighting “Brad Pitt” on a rooftop spread across social media, demonstrating the model’s ability to replicate celebrity likenesses with alarming accuracy.
Hollywood’s Response
- Motion Picture Association (MPA),CEO Charles Rivkin issued a statement demanding ByteDance “immediately cease its infringing activity,” calling it “unauthorized use of U.S. copyrighted works on a massive scale”
- Disney,Sent a formal cease-and-desist letter accusing ByteDance of “distributing and reproducing its intellectual property without permission,” alleging the model came pre-packaged with copyrighted characters
- SAG-AFTRA,Called it “blatant infringement,” specifically highlighting “the unauthorized use of our members’ voices and likenesses”
- Major Studios,Disney, Paramount, Netflix, Sony, and Universal have all raised concerns
ByteDance’s Response
On February 16, 2026, ByteDance pledged to add safeguards to Seedance 2.0:
- Strengthening content filters to prevent generation of copyrighted characters
- Implementing celebrity likeness detection and blocking
- Adding watermarks to AI-generated content
- Working with rights holders to establish usage guidelines
ByteDance had already suspended the voice-from-photo feature on February 10 after concerns about generating voices without consent.
What This Means for Users
If you use Seedance 2.0, be aware:
- Do not generate content using copyrighted characters (Disney, Marvel, DC, etc.)
- Do not generate content using celebrity likenesses without consent
- Do use it for original creative work, product demos, and marketing content
- Do use your own reference images and original characters
- Expect content filters to tighten in the coming weeks
Ethics, Safety & Content Disclosure
Beyond the copyright controversy, Seedance 2.0 raises broader ethical questions that every user and developer should understand.
Deepfake Risks
Seedance 2.0’s ability to replicate human likenesses with high fidelity makes it a powerful deepfake tool. While ByteDance is adding safeguards, the technology can still be misused for:
- Non-consensual intimate imagery
- Political disinformation and fake news videos
- Identity fraud and impersonation
- Harassment and reputation damage
Your responsibility: Never generate videos of real people without their explicit consent. Even if the technology allows it, the legal and ethical consequences are severe.
Watermarking & Content Provenance
ByteDance has committed to adding watermarks to AI-generated content. As a developer integrating the API, you should also:
- Store metadata indicating content was AI-generated
- Add visible or invisible watermarks to generated videos before distribution
- Implement the C2PA (Coalition for Content Provenance and Authenticity) standard where possible
- Never remove or obscure AI generation indicators
Platform Disclosure Requirements (2026)
Major platforms now require disclosure of AI-generated content:
Platform Requirement YouTube Must label “altered or synthetic” content in Creator Studio; undisclosed AI content may be removed Meta (Instagram/Facebook) “AI generated” label applied automatically or manually; required for realistic imagery TikTok Mandatory AI content label; auto-detection for AI-generated videos X (Twitter) Community Notes may flag AI content; voluntary disclosure encouraged LinkedIn AI-generated content must be disclosed; professional context requirements Responsible Use Guidelines
- Always disclose that content is AI-generated when publishing
- Never impersonate real individuals without consent
- Respect copyright in your input materials (reference images, videos, audio)
- Add attribution when using the tool for commercial work
- Consider impact before generating sensitive content (violence, political figures, minors)
- Store provenance data so the origin of content can always be traced
Best Practices and Tips
For Creators
- Write explicit prompts,Tell the model exactly which file serves which purpose. Vague prompts produce vague results.
- Start with 4-second clips,Iterate on short clips before committing to longer (and more expensive) 15-second generations.
- Prioritize high-impact assets,With a 12-file limit, choose reference files that matter most for your vision.
- Use the extend feature,Build a scene incrementally rather than trying to generate the perfect 15-second clip in one shot.
- Match aspect ratios to platforms,16:9 for YouTube, 9:16 for TikTok/Reels/Shorts, 1:1 for Instagram feed.
For Developers
- Store API keys in environment variables,Never hardcode secrets in source code.
- Implement retry logic with exponential backoff,The API may return 429 (rate limited) or 503 (service busy) during peak times.
- Use webhooks instead of polling in production,Polling works for scripts, but webhooks are more efficient at scale.
- Cache generated videos,Store results in S3 or your CDN to avoid regenerating the same content.
- Set timeouts,Generation can take up to 120 seconds. Set appropriate timeouts in your HTTP client.
- Start with third-party aggregators,If you need API access before February 24, third-party platforms offer OpenAI-compatible endpoints that will make migration to the official API seamless.
Limitations to Be Aware Of
Seedance 2.0 is impressive, but it is not perfect:
- 15-second cap,Maximum generation is 15 seconds. For longer content, you need to stitch clips together.
- No real-time generation,Each clip takes 30–120 seconds. This is not suitable for live or interactive applications.
- Text rendering,Text within generated videos can still be garbled or incorrect, though it is improving.
- Hands and fine details,While significantly improved, occasional artifacts in hands and fingers still occur.
- Content filters,Expect increasingly strict content moderation as ByteDance responds to copyright concerns.
- API not yet live,The official API does not launch until February 24, 2026. Current third-party access may have limitations.
- Geographic restrictions,Some features are currently limited to Chinese users via Jianying (CapCut) app, though Dreamina is available globally.
10 Killer Application Scenarios
Here are the most impactful ways teams are using Seedance 2.0 right now, each representing a market worth billions.
1. Product Demo Videos (E-commerce)
Upload a product photo as
@Image1, add a lifestyle reference video as@Video1, and describe the scene. A 15-second product video that would cost $5,000+ from a production house takes 60 seconds and costs pennies. Fashion brands are generating virtual try-on videos showing clothes on AI models from multiple angles.2. Social Media Content at Scale
Create platform-native vertical videos (9:16) for TikTok, Instagram Reels, and YouTube Shorts. The beat-sync feature automatically aligns visual cuts to your music track. Agencies are generating 50+ video variants per campaign to A/B test at a scale that was previously impossible.
3. AI News Anchors & Digital Humans
Upload a spokesperson photo and script audio to generate consistent talking-head videos. News outlets, corporate communications, and educational platforms are using this for multilingual content delivery without hiring actors for each language.
4. Music Video Generation
Upload a music track as
@Audio1, provide character references as images, and describe the visual narrative. Seedance 2.0’s beat-sync capability creates music videos where cuts, camera movements, and character actions automatically align to the rhythm. Independent artists can now produce music videos for the cost of a streaming subscription.5. Game Development & Trailers
Upload character concept art and motion reference videos to prototype cinematic sequences before committing to full 3D production. Studios are generating user acquisition ad creatives at scale, testing 100 video ads instead of 5, and validating game concepts weeks earlier in the pipeline.
6. Manga & Comic-to-Animation
Upload manga pages or comic panels as
@Image1through@Image9and prompt:"Animate these panels into a continuous scene with camera transitions between each panel."Independent manga artists and webtoon creators can now produce animated trailers for their series without animation budgets.7. Real Estate Virtual Tours
Upload interior photos of a property and generate walkthrough videos with smooth camera movements. Add ambient audio for atmosphere. Real estate agents are creating virtual tour videos for every listing instead of just premium properties.
8. Personalized Ad Generation
Combine the API with customer segmentation data to generate personalized video ads at scale. Upload different product images for different segments, vary the scenes and styles, and produce hundreds of targeted video variants programmatically.
9. Education & Training Materials
Upload diagrams, charts, or whiteboard images and describe the animation you need. Medical schools are generating anatomical animations. Engineering firms are creating safety training videos. The multimodal input makes it easy to control exactly what appears on screen.
10. Film Pre-Visualization
Directors and cinematographers are using Seedance 2.0 to pre-visualize scenes before committing to expensive physical shoots. Upload location photos, actor headshots, and storyboard sketches as references, then generate rough cuts of entire sequences. What used to take a pre-viz team weeks now takes hours.
Frequently Asked Questions
Is Seedance 2.0 free to use?
Partially. Dreamina offers daily free login points that allow a few generations per day. New users can also access a 1 RMB (~$0.14) trial. For regular use, the Standard membership costs approximately $9.60/month. The API will have a free tier with 5 generations per day when it launches.
How do I use Seedance 2.0?
The easiest way is through Dreamina. Sign up, select the Seedance 2.0 model, upload your reference files (images, videos, audio), write a prompt using
@references, configure settings (duration, aspect ratio), and hit generate. Your video will be ready in 30–120 seconds.Is there an API for Seedance 2.0?
The official API through Volcengine/BytePlus launches on February 24, 2026. Until then, third-party aggregator platforms offer API access with OpenAI-compatible endpoints. See the Developer Guide section above for code examples.
Can Seedance 2.0 generate audio?
Yes. Seedance 2.0 natively generates synchronized audio including dialogue with lip sync, background music, and ambient sound effects. You can also upload your own audio files for the model to reference. Note: the voice-from-photo feature has been suspended.
How does Seedance 2.0 compare to Sora 2?
Seedance 2.0 wins on multimodal control (12-file input vs single image), native audio, and price ($9.60/month vs $200/month). Sora 2 wins on physics accuracy, temporal consistency, and clip duration (25 seconds vs 15 seconds). Choose Seedance for precision and control; choose Sora for realism.
Is it legal to use Seedance 2.0?
Using Seedance 2.0 itself is legal. However, generating content that infringes on copyrights (Disney characters, Marvel heroes, etc.) or uses celebrity likenesses without consent is not. Use your own original characters and reference materials to stay safe.
What languages does Seedance 2.0 support?
Seedance 2.0 accepts prompts in multiple languages, with English and Chinese having the best results. The Dreamina interface is available in English, Chinese, Japanese, and other languages.
Can I use Seedance 2.0 videos commercially?
Yes, videos generated on paid plans can be used commercially, subject to Dreamina’s terms of service. Always ensure your input materials (reference images, videos, audio) do not infringe on third-party rights.
What is ChatCut and how does it work with Seedance 2.0?
ChatCut is an autonomous AI video editing agent that can call Seedance 2.0 as an integrated tool. You upload footage or generate new clips with Seedance, then use natural language commands to edit: “cut to the beat,” “remove the awkward pause,” or “restructure for a 30-second Reel.” It handles the full workflow from generation to polished export.
What is Little Skylark (Xiaoyunque)?
Little Skylark (Xiaoyunque / 小云雀) is a ByteDance creative app that currently offers Seedance 2.0 generation at zero cost during a promotional period. New users get 3 free generations on signup plus 120 daily points. It is the best way to experiment with Seedance 2.0 for free, though the interface is primarily in Chinese.
What is the best prompt format for Seedance 2.0?
Use the director’s formula: Subject + Action + Camera + Scene + Style + Constraints. Keep prompts between 30-100 words. Be specific about camera movements (dolly, track, crane), use the @ reference system for uploaded files, and add consistency fixes like “same character, same clothing, no face changes” for multi-shot sequences.
Will Seedance 2.0 replace video editors?
Not entirely, but it will change what video editors do. AI handles the generation and basic assembly. Human editors become “prompt engineers” and aesthetic gatekeepers, focusing on creative direction, storytelling, and quality control rather than frame-by-frame editing. The role evolves rather than disappears.
What’s Next for Seedance?
Based on ByteDance’s roadmap and industry trends, expect:
- Longer generation durations,Currently capped at 15 seconds, likely to extend to 30+ seconds
- 4K output,Following Kling 3.0’s 4K/60fps benchmark
- CapCut integration,ByteDance has confirmed Seedance 2.0 is coming to CapCut for global users
- Stricter content moderation,Ongoing response to copyright concerns
- Official API launch,February 24, 2026 through Volcengine
- Real-time generation,The holy grail of AI video, potentially enabled by the Diffusion Transformer architecture
Conclusion
Seedance 2.0 is not just an incremental update,it represents a fundamental shift in AI video generation. The 12-file multimodal input system, native audio generation, and multi-shot storytelling capabilities put it in a category of its own. And at ~$9.60/month, it democratizes Hollywood-level video production for creators and developers who could never afford traditional production costs.
For developers, the async API pattern is straightforward to integrate, and the Python examples in this guide give you a production-ready starting point. For creators, the @ reference system gives you the kind of precise control that other models simply do not offer.
The copyright controversy is real and will shape how the tool evolves. Use it responsibly,create original content, use your own reference materials, and respect intellectual property.
The AI video generation space is moving at breakneck speed. Seedance 2.0 just raised the bar.
Building AI-powered video features into your product? At Metosys, we specialize in AI integration and automation and cloud infrastructure. Whether you need help integrating Seedance 2.0’s API, building a video generation pipeline, or scaling your AI workloads,we have done it before. Get in touch to discuss your project.
Sources:
- Seedance 2.0,ByteDance Official
- Dreamina,Seedance 2.0 Video Generator
- Hollywood Isn’t Happy About Seedance 2.0,TechCrunch
- MPA Denounces ‘Massive’ Infringement on Seedance 2.0,Variety
- ByteDance Pledges Safeguards After Hollywood Backlash,CNBC
- New China AI Models: Alibaba, ByteDance, Kuaishou,CNBC
- Seedance 2.0 Developer Guide & Comparison,SitePoint
- Seedance 2.0 vs Sora vs Runway Gen-4 API Comparison,SitePoint
- Seedance API Complete Integration Guide,AIVidPipeline
- Seedance 2.0 Complete Guide,WaveSpeedAI
- What Is Seedance 2.0?,DataCamp
- Seedance 2.0 API Integration Guide,AI Free API
- Seedance 2.0 Shockwave: Cost Collapse Across Industries,TechFlow
- From 1.0 to 2.0: Is Seedance the New King?,Breaking AC
- Seedance 1.5 vs 2.0: What Changed,D-Addicts
- Seedance 2.0 Prompt Guide,GlobalGPT
- Seedance 2.0 Prompt Template Framework,WaveSpeedAI
- ChatCut,AI Video Editing Agent
- ByteDance Pledges Safeguards After Disney Legal Threat,Variety
-
What Is AWS Data Pipeline? Architecture, Use Cases & Modern Alternatives (2026 Guide)
AWS Data Pipeline is a managed web service from Amazon Web Services that automates the movement and transformation of data between different AWS services and on-premises data sources. It lets you define data-driven workflows where tasks run on a schedule and depend on the successful completion of previous tasks — essentially an orchestration layer for ETL (Extract, Transform, Load) jobs across your AWS infrastructure.
However, there is one critical update every developer and data engineer should know: AWS Data Pipeline is now deprecated. The service is in maintenance mode and is no longer available to new customers. In this guide, we cover everything about AWS Data Pipeline — how it works, its components, pricing, real-world use cases — and, most importantly, how to build a modern serverless data pipeline using EMR Serverless, SageMaker Pipelines, Lambda, SQS, and the Medallion Architecture on S3.
What Is AWS Data Pipeline?
AWS Data Pipeline is a cloud-based data workflow orchestration service that was designed to help businesses reliably process and move data at specified intervals. Think of it as a scheduling and execution engine for your data tasks.
At its core, AWS Data Pipeline allows you to:
- Move data between AWS services like Amazon S3, Amazon RDS, Amazon DynamoDB, and Amazon Redshift
- Transform data using compute resources like Amazon EC2 or Amazon EMR
- Schedule workflows to run at defined intervals (hourly, daily, weekly)
- Handle failures automatically with built-in retry logic and failure notifications
- Connect on-premises data sources with AWS cloud storage
The service was originally built to solve a common problem: data sits in different places (databases, file systems, data warehouses), and businesses need to move and transform that data regularly without writing custom scripts for every workflow.
Important: AWS Data Pipeline Is Now Deprecated
As of 2024, AWS Data Pipeline is no longer available to new customers. Amazon has placed the service in maintenance mode, which means:
- No new features are being developed
- No new AWS regions will be added
- Existing customers can continue using the service
- AWS recommends migrating to newer services
This is a significant development that affects any organization currently evaluating data orchestration tools on AWS. If you are starting a new project, you should skip AWS Data Pipeline entirely and choose one of the modern alternatives we cover later in this article.
For existing users, AWS has published migration guides to help transition workloads to services like Amazon MWAA (Managed Workflows for Apache Airflow) and AWS Step Functions.
How AWS Data Pipeline Works
AWS Data Pipeline operates on a simple but powerful execution model:
- You define a pipeline — a JSON-based configuration that specifies what data to move, where to move it, and what transformations to apply
- AWS Data Pipeline creates resources — it provisions EC2 instances or EMR clusters to execute your tasks
- Task Runner polls for work — a lightweight agent installed on compute resources checks for scheduled tasks
- Tasks execute — data is read from source, transformed, and written to the destination
- Pipeline monitors itself — built-in retry logic handles transient failures, and SNS notifications alert you to persistent problems
The execution follows a dependency graph. If Task B depends on Task A completing successfully, AWS Data Pipeline enforces that ordering automatically.
Scheduling Model
AWS Data Pipeline uses a time-based scheduling model. You define a schedule (for example, “run every day at 2 AM UTC”), and the pipeline creates a new execution instance for each scheduled run. Each instance processes data independently, making it easy to track success or failure for specific time windows.
Key Components of AWS Data Pipeline
Understanding the core components is essential to grasping how AWS Data Pipeline works:
Pipeline Definition
The pipeline definition is the blueprint of your data workflow. It is a JSON document that describes all the objects in your pipeline — data sources, destinations, activities, schedules, and their relationships.
Data Nodes
Data nodes define where your data lives — both the input source and the output destination:
- S3DataNode — Amazon S3 buckets and prefixes
- SqlDataNode — relational databases (RDS, EC2-hosted databases)
- DynamoDBDataNode — Amazon DynamoDB tables
- RedshiftDataNode — Amazon Redshift clusters
Activities
Activities define the work your pipeline performs:
- CopyActivity — moves data from one location to another
- EmrActivity — runs processing jobs on Amazon EMR clusters
- ShellCommandActivity — executes custom shell scripts on EC2 instances
- SqlActivity — runs SQL queries against databases
- HiveActivity — runs Apache Hive queries on EMR
Task Runners
Task Runners are lightweight agents that poll AWS Data Pipeline for scheduled tasks. When a task is ready, the Task Runner executes it on the assigned compute resource.
Preconditions
Preconditions are checks that must pass before a pipeline activity executes. For example, you might verify a source file exists in S3 before attempting to process it.
Schedules
Schedules define when your pipeline runs. You configure the start time, frequency, and end time. AWS Data Pipeline supports both one-time and recurring schedules.
AWS Data Pipeline Use Cases (Real-World Examples)
Before its deprecation, AWS Data Pipeline was commonly used for these scenarios:
1. E-Commerce Daily Sales ETL
Scenario: An online retailer needs to analyze sales performance across product categories and regions.
Every night at 2 AM, the pipeline extracts order data from their production RDS database, joins it with the product catalog stored in DynamoDB, aggregates sales by category and region, and loads the summary into Amazon Redshift.
Pipeline flow:
RDS → EC2 (transform & join) → RedshiftBusiness value: The marketing team opens their dashboard every morning and sees yesterday’s revenue breakdown by category, top-selling products, and regional performance — all without a single manual SQL query.
2. Web Server Log Processing & Analytics
Scenario: A SaaS company with 50 EC2 instances running Nginx wants to understand their traffic patterns.
The pipeline collects access logs from all instances daily, archives them to S3, and runs a weekly EMR job that processes the logs to generate reports: top pages by traffic, error rate trends, geographic distribution, and peak usage hours.
Pipeline flow:
EC2 logs → S3 (daily archive) → EMR (weekly analysis) → S3 (reports)Business value: The engineering team spots a 3x increase in 404 errors from mobile users, leading them to discover and fix a broken API endpoint that was costing them 12% of mobile traffic.
3. Healthcare Data Synchronization
Scenario: A hospital network runs their patient management system on an on-premises SQL Server database but wants their analytics team to work in AWS.
Every 6 hours, the pipeline syncs patient appointment data from the on-premises database to AWS RDS using the Task Runner installed on a local server. The data then feeds into Redshift for operational analytics.
Pipeline flow:
On-premises SQL Server → Task Runner → RDS → RedshiftBusiness value: Compliance-friendly data movement with full audit trails. The analytics team can predict patient no-show rates and optimize scheduling without touching the production database.
4. Financial Reporting Pipeline
Scenario: A fintech company must generate regulatory reports every quarter, which requires combining transaction data with compliance rules.
The pipeline extracts transaction records from DynamoDB, runs them through an EMR cluster that applies PII masking (replacing real names with hashes), converts currencies to USD, validates against compliance rules, and loads the clean dataset into Redshift.
Pipeline flow:
DynamoDB → EMR (PII masking + currency conversion) → RedshiftBusiness value: What used to take a compliance team 2 weeks of manual work now runs automatically in 4 hours, with consistent results every quarter.
5. Cross-Region Data Replication
Scenario: A global company with teams in the US and EU needs both teams to have access to fresh analytics data, but running cross-region queries is too slow and expensive.
The pipeline replicates the daily S3 data from
us-east-1toeu-west-1on a nightly schedule, so the European team queries local data with low latency.Pipeline flow:
S3 (us-east-1) → S3 (eu-west-1)Business value: EU analysts get sub-second query times instead of 30-second cross-region queries, and data transfer costs are predictable since it runs on a fixed schedule rather than on-demand.
AWS Data Pipeline Pricing
AWS Data Pipeline pricing is based on how frequently your activities run:
Activity Type Cost Low-frequency activity (runs once per day or less) $0.60 per activity per month High-frequency activity (runs more than once per day) $1.00 per activity per month Low-frequency precondition $0.60 per precondition per month High-frequency precondition $1.00 per precondition per month Free Tier
New AWS accounts (less than 12 months old) qualify for the AWS Free Tier:
- 3 low-frequency preconditions per month
- 5 low-frequency activities per month
Important: AWS Data Pipeline pricing covers only the orchestration. You still pay separately for the underlying compute (EC2 instances, EMR clusters) and storage (S3, RDS, Redshift) that your pipeline uses.
Pros and Cons of AWS Data Pipeline
Pros Cons Native AWS integration with S3, RDS, DynamoDB, Redshift, EMR Deprecated — no new features or region support Built-in retry and fault tolerance Dated UI and developer experience Supports on-premises data sources via Task Runner Limited to batch processing — no real-time support Schedule-based automation with dependency management Debugging failed jobs is difficult Low orchestration cost Lock-in to AWS ecosystem Visual pipeline designer in console JSON-based definitions are verbose and hard to maintain AWS Data Pipeline Alternatives (2026)
Since AWS Data Pipeline is deprecated, here are the recommended alternatives:
Amazon MWAA (Managed Workflows for Apache Airflow)
Amazon MWAA is the most direct replacement. It is a fully managed Apache Airflow service that handles the infrastructure for running Airflow workflows.
Best for: Complex, multi-step ETL workflows with branching logic and dynamic task generation.
AWS Step Functions
AWS Step Functions is a serverless orchestration service that coordinates AWS services using visual workflows.
Best for: Serverless architectures, event-driven processing, and workflows that integrate with Lambda functions.
Amazon EventBridge
Amazon EventBridge is an event bus that triggers workflows based on events from AWS services, SaaS applications, or custom sources.
Best for: Event-driven architectures where data processing starts in response to specific triggers.
Third-Party Alternatives
- Apache Airflow (self-hosted) — maximum flexibility, you manage the infrastructure
- Dagster — modern data orchestration with built-in data quality checks
- Prefect — Python-native workflow orchestration with a generous free tier
- dbt (data build tool) — focused on SQL transformations inside data warehouses
AWS Data Pipeline vs Step Functions
Feature AWS Data Pipeline AWS Step Functions Status Deprecated (maintenance mode) Actively developed Execution model Schedule-based Event-driven or schedule-based Compute EC2, EMR Lambda, ECS, any AWS service Serverless No (requires EC2/EMR) Yes (fully serverless) Pricing Per activity per month Per state transition Visual editor Basic Advanced (Workflow Studio) Error handling Retry with notifications Catch, retry, fallback states Real-time support No Yes For most new projects, AWS Step Functions is the better choice due to its serverless nature and active development.
Is AWS Data Pipeline Serverless?
No, AWS Data Pipeline is not serverless. It requires provisioning EC2 instances or EMR clusters to execute pipeline activities. The Task Runner agent must run on compute resources that you manage.
This is a key difference from modern alternatives like AWS Step Functions, which are fully serverless — you define your workflow, and AWS handles everything else.
Modern AWS Data Pipeline Architecture (2026)
Now that AWS Data Pipeline is deprecated, what does a modern data pipeline look like on AWS? Here is a production-ready architecture using current AWS services:
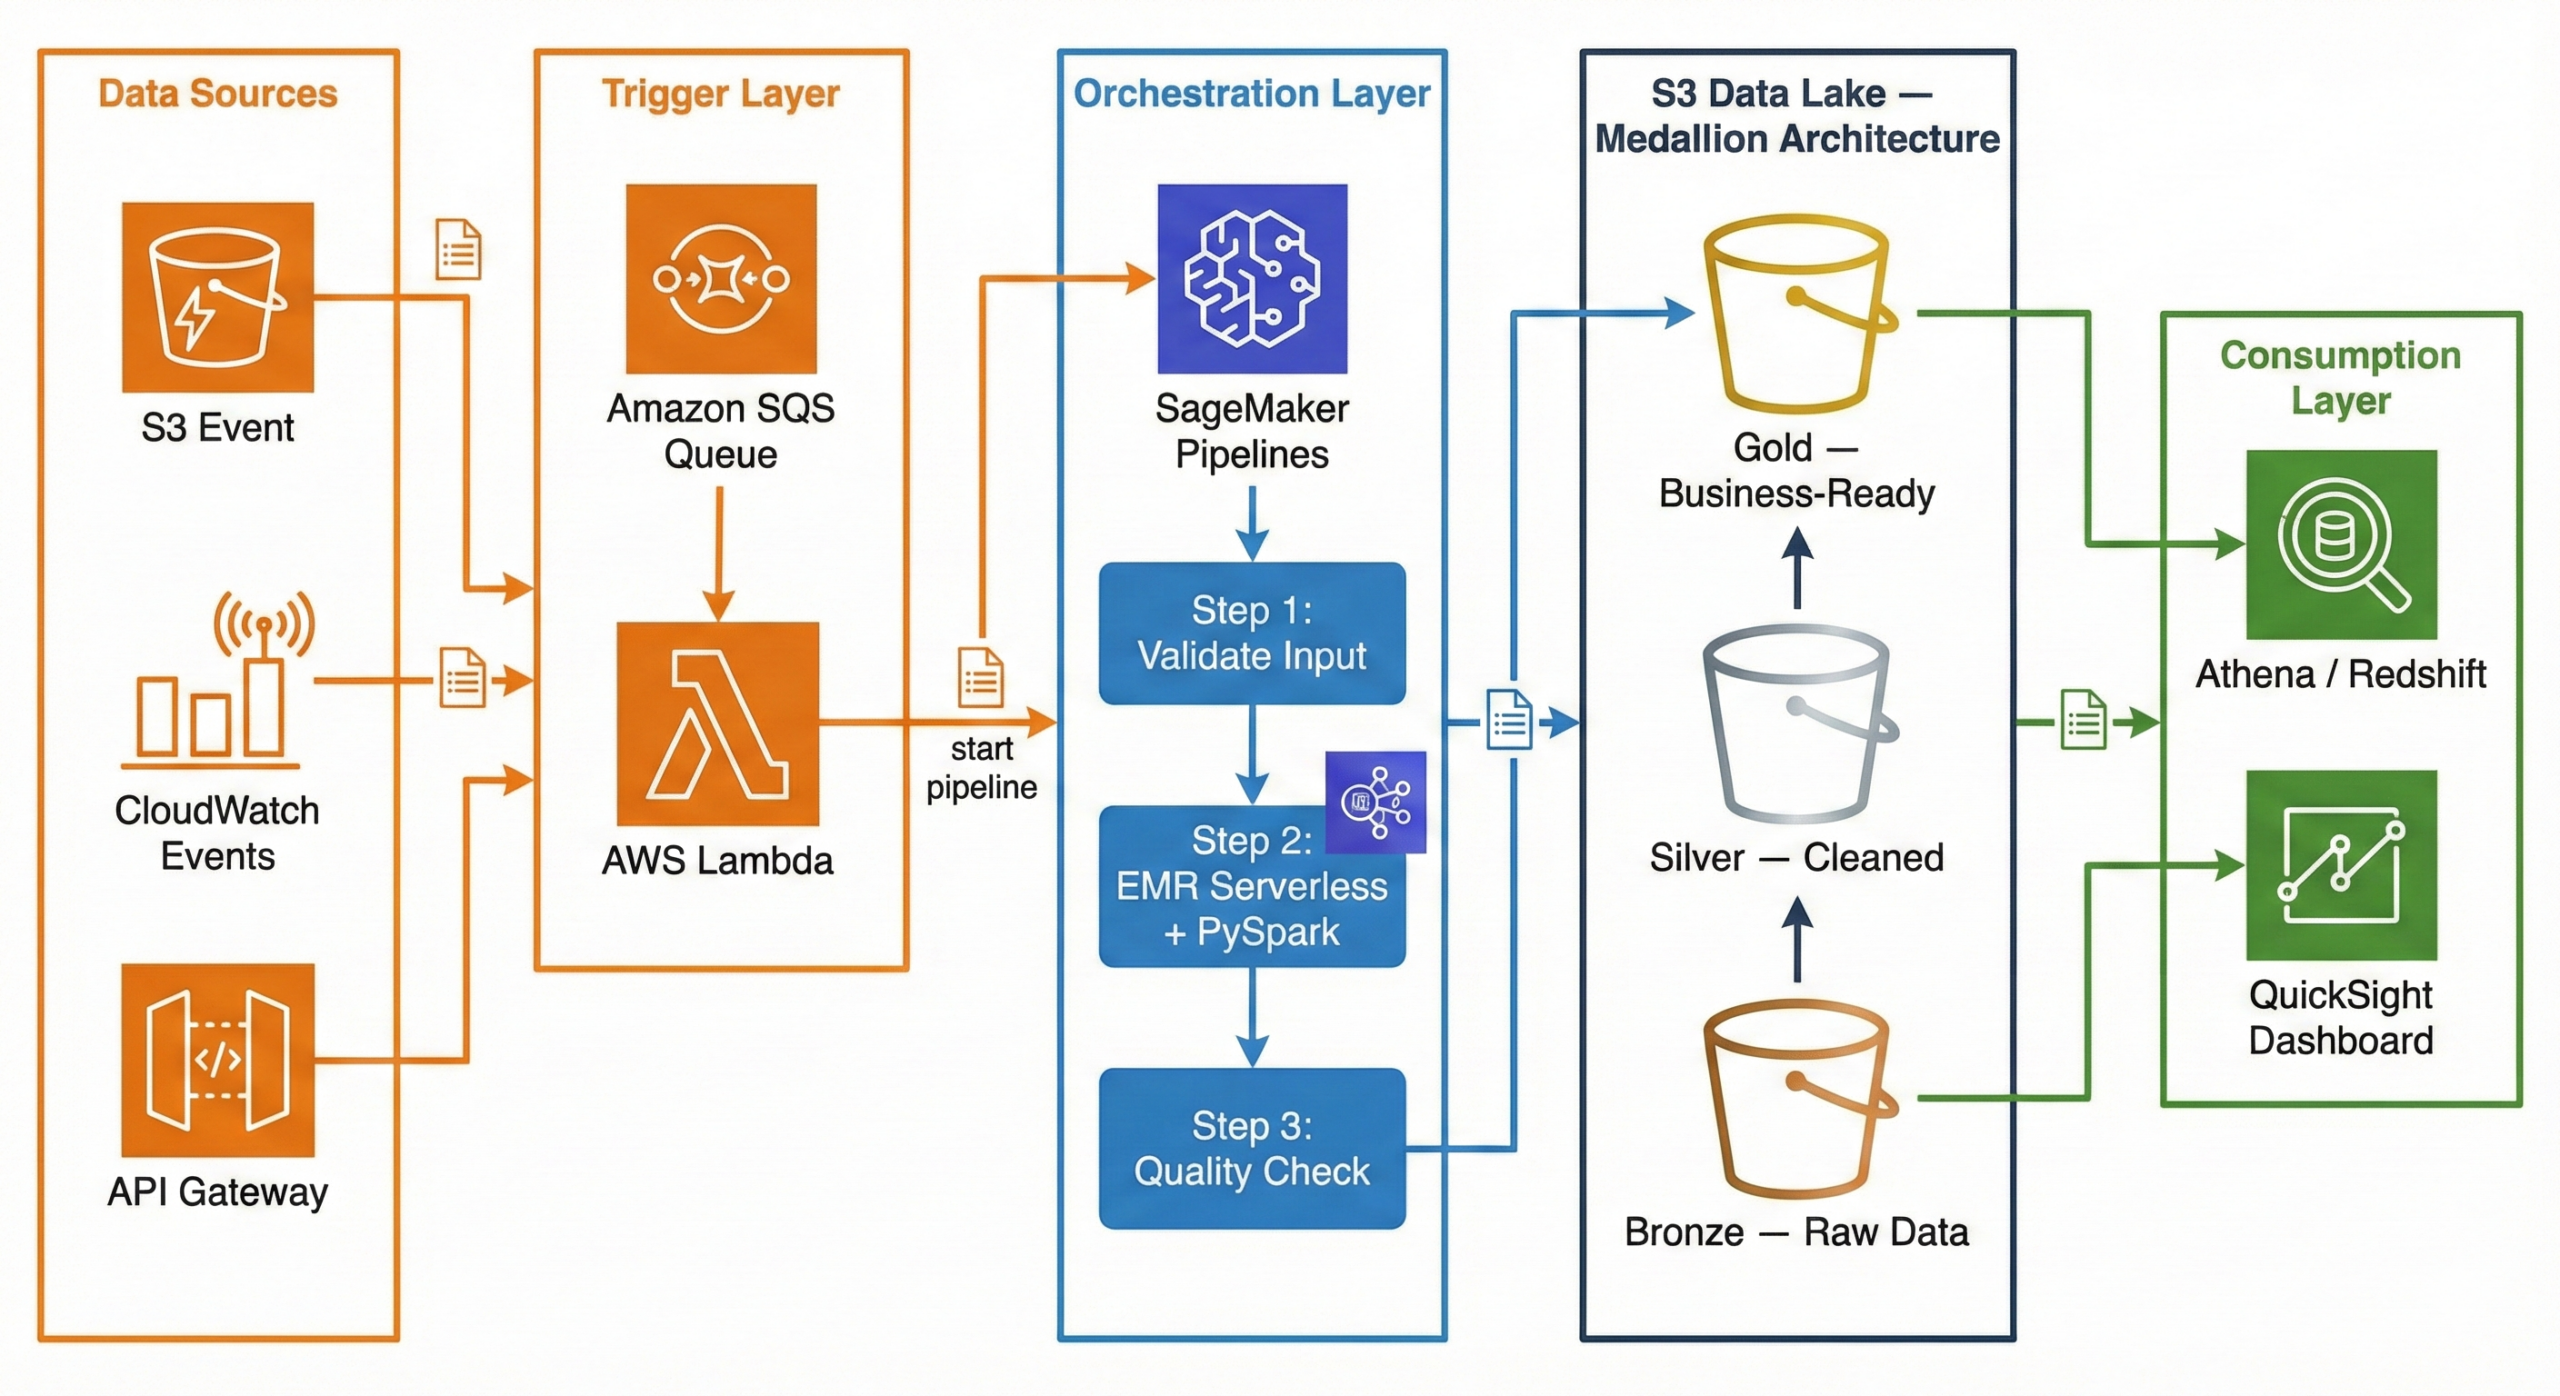
┌─────────────┐     ┌─────────────┐     ┌──────────────────────┐
│ Data Sources │     │  CloudWatch  │     │   API Gateway /      │
│  (S3 Event)  │────▶│  Events      │────▶│   External Triggers  │
└──────┬───────┘     └──────┬───────┘     └──────────┬───────────┘
       │                    │                        │
       ▼                    ▼                        ▼
┌──────────────────────────────────────────────────────────────┐
│                     Amazon SQS (Queue)                       │
│              Decouples triggers from processing              │
└──────────────────────────┬───────────────────────────────────┘
                           │
                           ▼
┌──────────────────────────────────────────────────────────────┐
│                    AWS Lambda (Trigger)                       │
│         Validates event, starts SageMaker Pipeline           │
└──────────────────────────┬───────────────────────────────────┘
                           │
                           ▼
┌──────────────────────────────────────────────────────────────┐
│              Amazon SageMaker Pipelines                      │
│                   (Orchestration)                             │
│                                                              │
│  ┌──────────┐   ┌───────────────┐   ┌────────────────────┐  │
│  │  Step 1:  │──▶│    Step 2:     │──▶│      Step 3:       │  │
│  │ Validate  │   │ EMR Serverless │   │  Quality Check     │  │
│  │  Input    │   │  + PySpark     │   │  + Write to Gold   │  │
│  └──────────┘   └───────────────┘   └────────────────────┘  │
└──────────────────────────────────────────────────────────────┘
                           │
                           ▼
┌──────────────────────────────────────────────────────────────┐
│                    Amazon S3 Data Lake                        │
│                                                              │
│  ┌────────────┐   ┌────────────┐   ┌─────────────────────┐  │
│  │   Bronze    │──▶│   Silver    │──▶│       Gold          │  │
│  │ (Raw Data)  │   │ (Cleaned)   │   │ (Business-Ready)   │  │
│  └────────────┘   └────────────┘   └─────────────────────┘  │
└──────────────────────────────────────────────────────────────┘
                           │
                    ┌──────┴──────┐
                    ▼             ▼
             ┌───────────┐  ┌──────────┐
             │ Redshift / │  │ QuickSight│
             │  Athena    │  │ Dashboard │
             └───────────┘  └──────────┘
Why This Architecture?
Trigger Layer — Lambda + SQS:
When a new file lands in S3 (or a scheduled CloudWatch Event fires), the event goes to an SQS queue. A Lambda function picks it up, validates the event, and kicks off the SageMaker Pipeline. Why SQS in between? It decouples the trigger from the processing. If the pipeline is busy, messages wait in the queue instead of being lost. If something fails, the message goes to a dead-letter queue for investigation.
Orchestration Layer — SageMaker Pipelines:
SageMaker Pipelines manages the end-to-end workflow. It defines each step as a node in a directed acyclic graph (DAG), handles retries, caches intermediate results, and provides a visual interface to monitor progress. While SageMaker is known for machine learning, its pipeline orchestration works perfectly for general-purpose data engineering too.
Processing Layer — EMR Serverless + PySpark:
Amazon EMR Serverless runs your PySpark jobs without you ever touching a cluster. You submit your Spark code, EMR Serverless provisions the exact resources needed, runs the job, and shuts down. You pay only for the compute time used. No cluster management, no idle costs, and it auto-scales based on your data volume.
Storage Layer — S3 Data Lake (Medallion Architecture):
Data flows through three layers in S3: Bronze (raw), Silver (cleaned), Gold (business-ready). This is called the Medallion Architecture, and we explain it in full detail in the next section.
Consumption Layer — Athena / Redshift + QuickSight:
Once data reaches the Gold layer, analysts query it using Amazon Athena (serverless SQL directly on S3) or Amazon Redshift (data warehouse). QuickSight dashboards visualize the results for business stakeholders.
Implementing Medallion Architecture on AWS: A Practical Guide
The Medallion Architecture is the most popular pattern for organizing data in a data lake. If you have ever struggled with messy, unreliable data, this pattern will make your life significantly easier.
What Is Medallion Architecture? (The Simple Explanation)
Think of it like a kitchen:
- Bronze = Raw groceries from the store. You bring them home and put them in the fridge exactly as they are — unwashed vegetables, sealed packages, everything in its original state. You don’t touch anything.
- Silver = Ingredients washed, chopped, and measured. You clean the vegetables, cut the meat, measure the spices. Everything is prepared and organized, but it is not a meal yet.
- Gold = The finished meal, plated and ready to serve. You have combined the prepared ingredients into a dish that anyone can eat and enjoy.
In data terms:
Layer What It Contains Who Uses It Bronze Raw data exactly as received from the source Data engineers (debugging, reprocessing) Silver Cleaned, validated, deduplicated data with enforced schema Data analysts, data scientists Gold Aggregated, business-ready tables optimized for dashboards Business users, executives, BI tools Why not just clean the data once and store it? Because requirements change. A business rule that seems right today might be wrong next month. By keeping the raw data in Bronze, you can always go back and reprocess it with new logic. You never lose the original truth.
S3 Folder Structure (How to Set It Up)
Here is the actual folder structure you would create in your S3 bucket. This is what a production data lake looks like:
s3://mycompany-data-lake/
│
├── bronze/
│   ├── orders/
│   │   ├── dt=2026-02-10/
│   │   │   └── orders_raw_001.json
│   │   ├── dt=2026-02-11/
│   │   │   └── orders_raw_001.json
│   │   └── dt=2026-02-12/
│   │       └── orders_raw_001.json
│   ├── customers/
│   │   └── dt=2026-02-12/
│   │       └── customers_export.csv
│   └── products/
│       └── dt=2026-02-12/
│           └── products_catalog.json
│
├── silver/
│   ├── orders/
│   │   └── dt=2026-02-12/
│   │       └── part-00000.snappy.parquet
│   ├── order_items/
│   │   └── dt=2026-02-12/
│   │       └── part-00000.snappy.parquet
│   ├── customers/
│   │   └── dt=2026-02-12/
│   │       └── part-00000.snappy.parquet
│   └── products/
│       └── dt=2026-02-12/
│           └── part-00000.snappy.parquet
│
└── gold/
    ├── fact_daily_sales/
    │   └── dt=2026-02-12/
    │       └── part-00000.snappy.parquet
    ├── dim_customer/
    │   └── part-00000.snappy.parquet
    ├── dim_product/
    │   └── part-00000.snappy.parquet
    └── dim_date/
        └── part-00000.snappy.parquet
Why this structure?
dt=YYYY-MM-DDpartitioning — Each date gets its own folder. This makes it trivial to reprocess a specific day or query a date range- Separate folders per data source —
orders/,customers/,products/are isolated. Each can have its own IAM access policy - Parquet files in Silver/Gold — Parquet is a columnar format that is 60-80% smaller than JSON and 10x faster to query
- JSON/CSV preserved in Bronze — We keep the original format so we always have the raw truth
Step-by-Step: Bronze Layer (Raw Data Landing)
The Bronze layer is the simplest. Your only job is to land the data exactly as received and tag it with when it arrived. No cleaning, no transforming, no filtering.
What happens at this stage:
- Raw data arrives from source systems (APIs, databases, file exports)
- You write it to S3 with a date partition
- You add metadata: ingestion timestamp, source system name, file name
E-commerce example: Your Shopify store sends a webhook with order data as JSON. You receive it and store it immediately.
# ============================================
# BRONZE LAYER: Ingest raw data — no changes
# ============================================
from pyspark.sql import SparkSession
from pyspark.sql.functions import current_timestamp, lit
from datetime import date

spark = SparkSession.builder \
    .appName("bronze-ingestion") \
    .getOrCreate()

today = date.today().isoformat()  # "2026-02-12"

# Read raw JSON from the source — could be an API export, S3 drop, etc.
raw_orders = spark.read.json("s3://source-bucket/shopify-exports/orders.json")

# Add metadata columns (when did we ingest this? from where?)
bronze_orders = raw_orders \
    .withColumn("_ingested_at", current_timestamp()) \
    .withColumn("_source_system", lit("shopify")) \
    .withColumn("_file_name", lit("orders.json"))

# Write to Bronze — append mode, never overwrite historical data
bronze_orders.write \
    .mode("append") \
    .json(f"s3://mycompany-data-lake/bronze/orders/dt={today}/")

print(f"Bronze: {bronze_orders.count()} raw orders ingested for {today}")
Key rules for Bronze:
- Never modify the data — store exactly what the source sends
- Always use append mode — never overwrite previous days’ data
- Add metadata —
_ingested_at,_source_system,_file_namehelp with debugging - Keep the original format — if the source sends JSON, store JSON
Step-by-Step: Silver Layer (Clean & Validate)
The Silver layer is where the real work begins. You take the messy Bronze data and turn it into something reliable and consistent.
What happens at this stage:
- Remove duplicate records
- Drop rows with missing critical fields
- Enforce data types (strings to dates, strings to decimals)
- Standardize formats (trim whitespace, normalize country names)
- Flatten nested structures (explode arrays into separate rows)
- Handle null values with sensible defaults
E-commerce example: The raw Shopify JSON has duplicate orders (webhooks sometimes fire twice), some orders have no
customer_id, prices are stored as strings, and email addresses have trailing spaces.# ================================================ # SILVER LAYER: Clean, validate, and standardize # ================================================ from pyspark.sql.functions import col, to_date, trim, when, explode from pyspark.sql.types import DecimalType # Read all Bronze data bronze_orders = spark.read.json("s3://mycompany-data-lake/bronze/orders/") print(f"Bronze records: {bronze_orders.count()}") # ---- STEP 1: Remove duplicates ---- # Shopify webhooks sometimes fire twice for the same order deduped = bronze_orders.dropDuplicates(["order_id"]) # ---- STEP 2: Drop invalid records ---- # Orders without order_id or customer_id are useless valid = deduped.filter( col("order_id").isNotNull() & col("customer_id").isNotNull() ) # ---- STEP 3: Enforce data types ---- typed = valid \ .withColumn("total_price", col("total_price").cast(DecimalType(10, 2))) \ .withColumn("order_date", to_date(col("created_at"))) # ---- STEP 4: Clean string fields ---- cleaned = typed \ .withColumn("email", trim(col("email"))) \ .withColumn("shipping_country", when(col("shipping_country").isNull(), "Unknown") .otherwise(trim(col("shipping_country"))) ) # ---- STEP 5: Write to Silver as Parquet ---- cleaned.write \ .mode("overwrite") \ .partitionBy("order_date") \ .parquet("s3://mycompany-data-lake/silver/orders/") removed = bronze_orders.count() - cleaned.count() print(f"Silver: {cleaned.count()} clean orders ({removed} bad records removed)")Flattening nested data (bonus):
Shopify orders contain a
line_itemsarray — each order has multiple products. In Bronze, this is stored as a nested array. In Silver, we explode it into separate rows:# Flatten line_items array into separate rows order_items = cleaned \ .select("order_id", "order_date", explode("line_items").alias("item")) \ .select( "order_id", "order_date", col("item.product_id").alias("product_id"), col("item.name").alias("product_name"), col("item.quantity").cast("int").alias("quantity"), col("item.price").cast(DecimalType(10, 2)).alias("unit_price") ) order_items.write \ .mode("overwrite") \ .partitionBy("order_date") \ .parquet("s3://mycompany-data-lake/silver/order_items/")Why Parquet? A 1GB JSON file becomes ~200MB in Parquet. Queries that used to take 30 seconds now take 3 seconds. Parquet stores data in columns, so when you query only
order_dateandtotal_price, it does not read the other 20 columns at all.Step-by-Step: Gold Layer (Business-Ready Aggregations)
The Gold layer is where data becomes useful for business decisions. You join tables, calculate KPIs, and build the datasets that power dashboards.
What happens at this stage:
- Join related tables (orders + products + customers)
- Aggregate data (daily totals, averages, counts)
- Calculate business metrics (revenue, average order value, conversion rates)
- Build fact and dimension tables (star schema)
E-commerce example: Build a daily sales summary that the marketing team can view in QuickSight.
# ================================================
# GOLD LAYER: Aggregate and build business tables
# ================================================
from pyspark.sql.functions import sum, count, avg, round, countDistinct

# Read cleaned data from Silver
orders = spark.read.parquet("s3://mycompany-data-lake/silver/orders/")
order_items = spark.read.parquet("s3://mycompany-data-lake/silver/order_items/")
products = spark.read.parquet("s3://mycompany-data-lake/silver/products/")

# Join order items with product details
enriched = order_items.join(products, "product_id", "left")

# Build daily sales summary
daily_sales = (
    enriched
    .groupBy("order_date", "category")
    .agg(
        round(sum(col("unit_price") * col("quantity")), 2).alias("total_revenue"),
        count("order_id").alias("total_items_sold"),
        countDistinct("order_id").alias("unique_orders"),
        round(avg(col("unit_price") * col("quantity")), 2).alias("avg_item_value")
    )
    .orderBy("order_date", "category")
)

# Write to Gold layer
daily_sales.write \
    .mode("overwrite") \
    .partitionBy("order_date") \
    .parquet("s3://mycompany-data-lake/gold/fact_daily_sales/")

daily_sales.show(5, truncate=False)
Sample output:
+----------+-------------+-------------+----------------+-------------+--------------+
|order_date|category     |total_revenue|total_items_sold|unique_orders|avg_item_value|
+----------+-------------+-------------+----------------+-------------+--------------+
|2026-02-12|Electronics  |45230.50     |312             |156          |145.00        |
|2026-02-12|Clothing     |12450.75     |178             |89           |69.95         |
|2026-02-12|Home & Garden|8920.00      |90              |45           |99.11         |
|2026-02-12|Books        |3240.00      |216             |108          |15.00         |
|2026-02-12|Sports       |6780.25      |67              |34           |101.20        |
+----------+-------------+-------------+----------------+-------------+--------------+
Now your marketing team can open QuickSight, filter by date and category, and see exactly how each product line performed — no SQL knowledge required.
Data Modeling at Each Layer
Each layer uses a different modeling approach. Here is why:
Layer Modeling Style What It Looks Like Why Bronze No model (source-as-is) Raw JSON from Shopify, CSV from CRM Preserve the original structure for auditing and reprocessing Silver Normalized (3NF-like) Separate orders,order_items,customers,productstables with foreign keysRemove redundancy, enforce data types, create an enterprise-wide clean dataset Gold Denormalized (Star Schema) Central fact_daily_salestable +dim_customer,dim_product,dim_dateFast queries, fewer joins, dashboard-ready Bronze Modeling
There is no modeling in Bronze. You store exactly what the source sends:
- Shopify sends nested JSON? Store nested JSON.
- CRM exports a CSV with 50 columns? Store the entire CSV.
- The only thing you add is metadata:
_ingested_at,_source_system,_file_name
Silver Modeling (Normalized)
In Silver, you create clean, separate tables with proper relationships:
silver_orders          silver_order_items       silver_customers       silver_products
─────────────          ──────────────────       ────────────────       ───────────────
order_id (PK)          order_item_id (PK)       customer_id (PK)       product_id (PK)
customer_id (FK) ───┐  order_id (FK) ──────┐    name                   name
order_date           │  product_id (FK) ─┐  │    email                  category
total_price          │  quantity         │  │    country                brand
email                │  unit_price       │  │    segment                price
shipping_country     │                   │  │    created_at             sku
status               │                   │  │
                     │                   │  │
                     └───────────────────┘  └── Relationships enforce
                                                data integrity
Key principle: Each piece of information is stored in exactly one place. A customer’s name exists only in
silver_customers, not duplicated across every order row.Gold Modeling (Star Schema)
The Gold layer uses a star schema — one central fact table surrounded by dimension tables, forming a star shape:
                    ┌──────────────┐
                    │  dim_date    │
                    │──────────────│
                    │ date         │
                    │ day_of_week  │
                    │ month        │
                    │ quarter      │
                    │ year         │
                    │ is_weekend   │
                    │ is_holiday   │
                    └──────┬───────┘
                           │
┌──────────────┐   ┌──────┴───────────┐   ┌──────────────┐
│ dim_customer │   │ fact_daily_sales │   │ dim_product  │
│──────────────│   │──────────────────│   │──────────────│
│ customer_id  │◄──│ order_date (FK)  │──▶│ product_id   │
│ name         │   │ customer_id (FK) │   │ name         │
│ segment      │   │ product_id (FK)  │   │ category     │
│ country      │   │ total_revenue    │   │ brand        │
│ lifetime_val │   │ total_orders     │   │ price_tier   │
└──────────────┘   │ avg_order_value  │   └──────────────┘
                   │ quantity_sold    │
                   └──────────────────┘
Why star schema for Gold?
When a business user asks “Show me total revenue by country for Q1 2026,” the query only needs to join
fact_daily_saleswithdim_customeranddim_date. That is 2 simple joins instead of scanning 5 normalized tables. BI tools like QuickSight, Power BI, and Tableau are specifically optimized for star schemas — they understand facts and dimensions natively.S3 Partitioning Strategy (How Data Is Partitioned)
Partitioning is how you organize files within each layer so that queries only read the data they need instead of scanning everything.
The Wrong Way (Avoid This)
Many tutorials teach the Hive-style
year/month/daypartitioning:s3://data-lake/bronze/orders/year=2026/month=02/day=12/Why this is a problem:
- Creates too many small partitions — each one triggers an S3 LIST API call
- Date range queries become complex:
WHERE year=2026 AND month=02 AND day>=10 AND day<=28 - Real-world teams have hit Athena query length limits when scanning 100+ days because the generated SQL is too long
- A query for “last 3 months” scans ~90 partitions with 3 API calls each = 270 API calls just for metadata
The Right Way (Use This)
Use a single date partition key in ISO 8601 format:
s3://data-lake/bronze/orders/dt=2026-02-12/Why this works better:
- Clean range queries:
WHERE dt BETWEEN '2026-02-01' AND '2026-02-28' - Natural alphabetical sorting (2026-01 comes before 2026-02)
- Each partition maps to exactly one date — no ambiguity
- Query engines prune efficiently on a single key
Partitioning Strategy by Layer
Layer Partition Key Example Path Why Bronze dt(ingestion date)bronze/orders/dt=2026-02-12/Track when data arrived from the source Silver dt(business event date)silver/orders/dt=2026-02-12/Query by when the business event happened Gold Business key + date gold/sales/region=US/dt=2026-02-12/Optimized for common dashboard filter patterns Partition Sizing Rule of Thumb
- Aim for 128MB to 1GB per partition file
- If your daily data is only 50MB, consider weekly partitions instead:
dt=2026-W07/ - Too many tiny files = slow queries (the “small file problem”)
- Too few giant files = slow writes and wasted memory
Storage Format by Layer
Layer Format Compression Size vs JSON Why Bronze JSON or CSV (as received) None or GZIP 1x (original) Preserve the exact source format Silver Apache Parquet Snappy ~0.2x (80% smaller) Columnar format, fast reads, great compression Gold Apache Parquet Snappy ~0.2x (80% smaller) Same benefits + optimized for Athena and Redshift Spectrum Best Practices for Medallion Architecture on AWS
# Best Practice Why It Matters 1 Never delete Bronze data You can always reprocess with new business rules 2 Use Parquet + Snappy in Silver/Gold 70-80% storage savings, 10x faster queries 3 Single-key date partitioning ( dt=YYYY-MM-DD)Simpler queries, better partition pruning 4 S3 Lifecycle policies — Bronze to Infrequent Access after 30 days, Glacier after 90 Cut storage costs by 50-70% for old data 5 Register tables in AWS Glue Data Catalog Athena, Redshift Spectrum, and EMR can all query by table name 6 Star schema in Gold BI tools are optimized for fact + dimension tables 7 Start with one data source Get orders working end-to-end before adding customers, products, etc. 8 Add metadata in Bronze ( _ingested_at,_source)Essential for debugging and data lineage How to Migrate from AWS Data Pipeline
If you are currently using AWS Data Pipeline and need to migrate:
- Audit your existing pipelines — document all pipeline definitions, schedules, data sources, and destinations
- Choose your target service — Amazon MWAA for complex ETL, Step Functions for serverless, SageMaker Pipelines for ML-integrated workflows
- Recreate pipeline logic — translate your pipeline definitions into the target format (Airflow DAGs, Step Functions state machines, etc.)
- Run in parallel — keep both old and new pipelines running to verify output consistency
- Validate data integrity — compare outputs from both systems
- Decommission — once confident, disable the AWS Data Pipeline version
Frequently Asked Questions
What is the difference between AWS Data Pipeline and ETL?
ETL (Extract, Transform, Load) is a process — it describes the pattern of pulling data from sources, transforming it, and loading it into a destination. AWS Data Pipeline is a tool that orchestrates ETL processes. The actual extraction, transformation, and loading are performed by other services like EMR, EC2, or Redshift.
Is AWS Data Pipeline still available?
For existing customers, yes — it continues to function. However, it is not available to new customers. AWS recommends Amazon MWAA or AWS Step Functions for new projects.
What replaced AWS Data Pipeline?
There is no single direct replacement:
- Amazon MWAA for complex ETL workflows (closest 1:1 replacement)
- AWS Step Functions for serverless orchestration
- SageMaker Pipelines for ML-integrated data workflows
- Amazon EventBridge for event-based triggers
Can I still use AWS Data Pipeline?
Yes, if you are an existing customer. However, you should start planning a migration since the service will not receive new features, and AWS could eventually announce an end-of-life date.
What is Medallion Architecture?
Medallion Architecture organizes data into three layers — Bronze (raw), Silver (cleaned), and Gold (business-ready). Each layer progressively improves data quality. It is the standard pattern for building data lakes on S3.
Is EMR Serverless better than regular EMR?
For most data pipeline use cases, yes. EMR Serverless eliminates cluster management — you submit your PySpark job and AWS handles provisioning, scaling, and termination. You pay only for the compute time used. Use regular EMR only if you need persistent clusters or custom configurations.
Conclusion
AWS Data Pipeline was a pioneering service that introduced many organizations to managed data orchestration on AWS. Its ability to schedule, execute, and monitor data workflows made it a valuable tool for batch processing and ETL automation.
However, with the service now in maintenance mode and unavailable to new customers, it is time to build with modern tools. The combination of SageMaker Pipelines for orchestration, EMR Serverless with PySpark for processing, Lambda + SQS for triggering, and the Medallion Architecture on S3 for storage gives you a production-ready, serverless, and cost-efficient data pipeline that scales from gigabytes to petabytes.
Whether you are building your first data pipeline or migrating from a legacy system, the key principles remain the same: keep your raw data safe in Bronze, clean it thoroughly in Silver, and serve it beautifully in Gold.
Need help building modern data pipelines on AWS? At Metosys, we specialize in ETL pipeline development, AWS data engineering with Glue and Redshift, and workflow automation with Apache Airflow. Our data engineers can help you migrate from legacy systems or build new pipelines from scratch. Get in touch to discuss your project.
Sources:
-
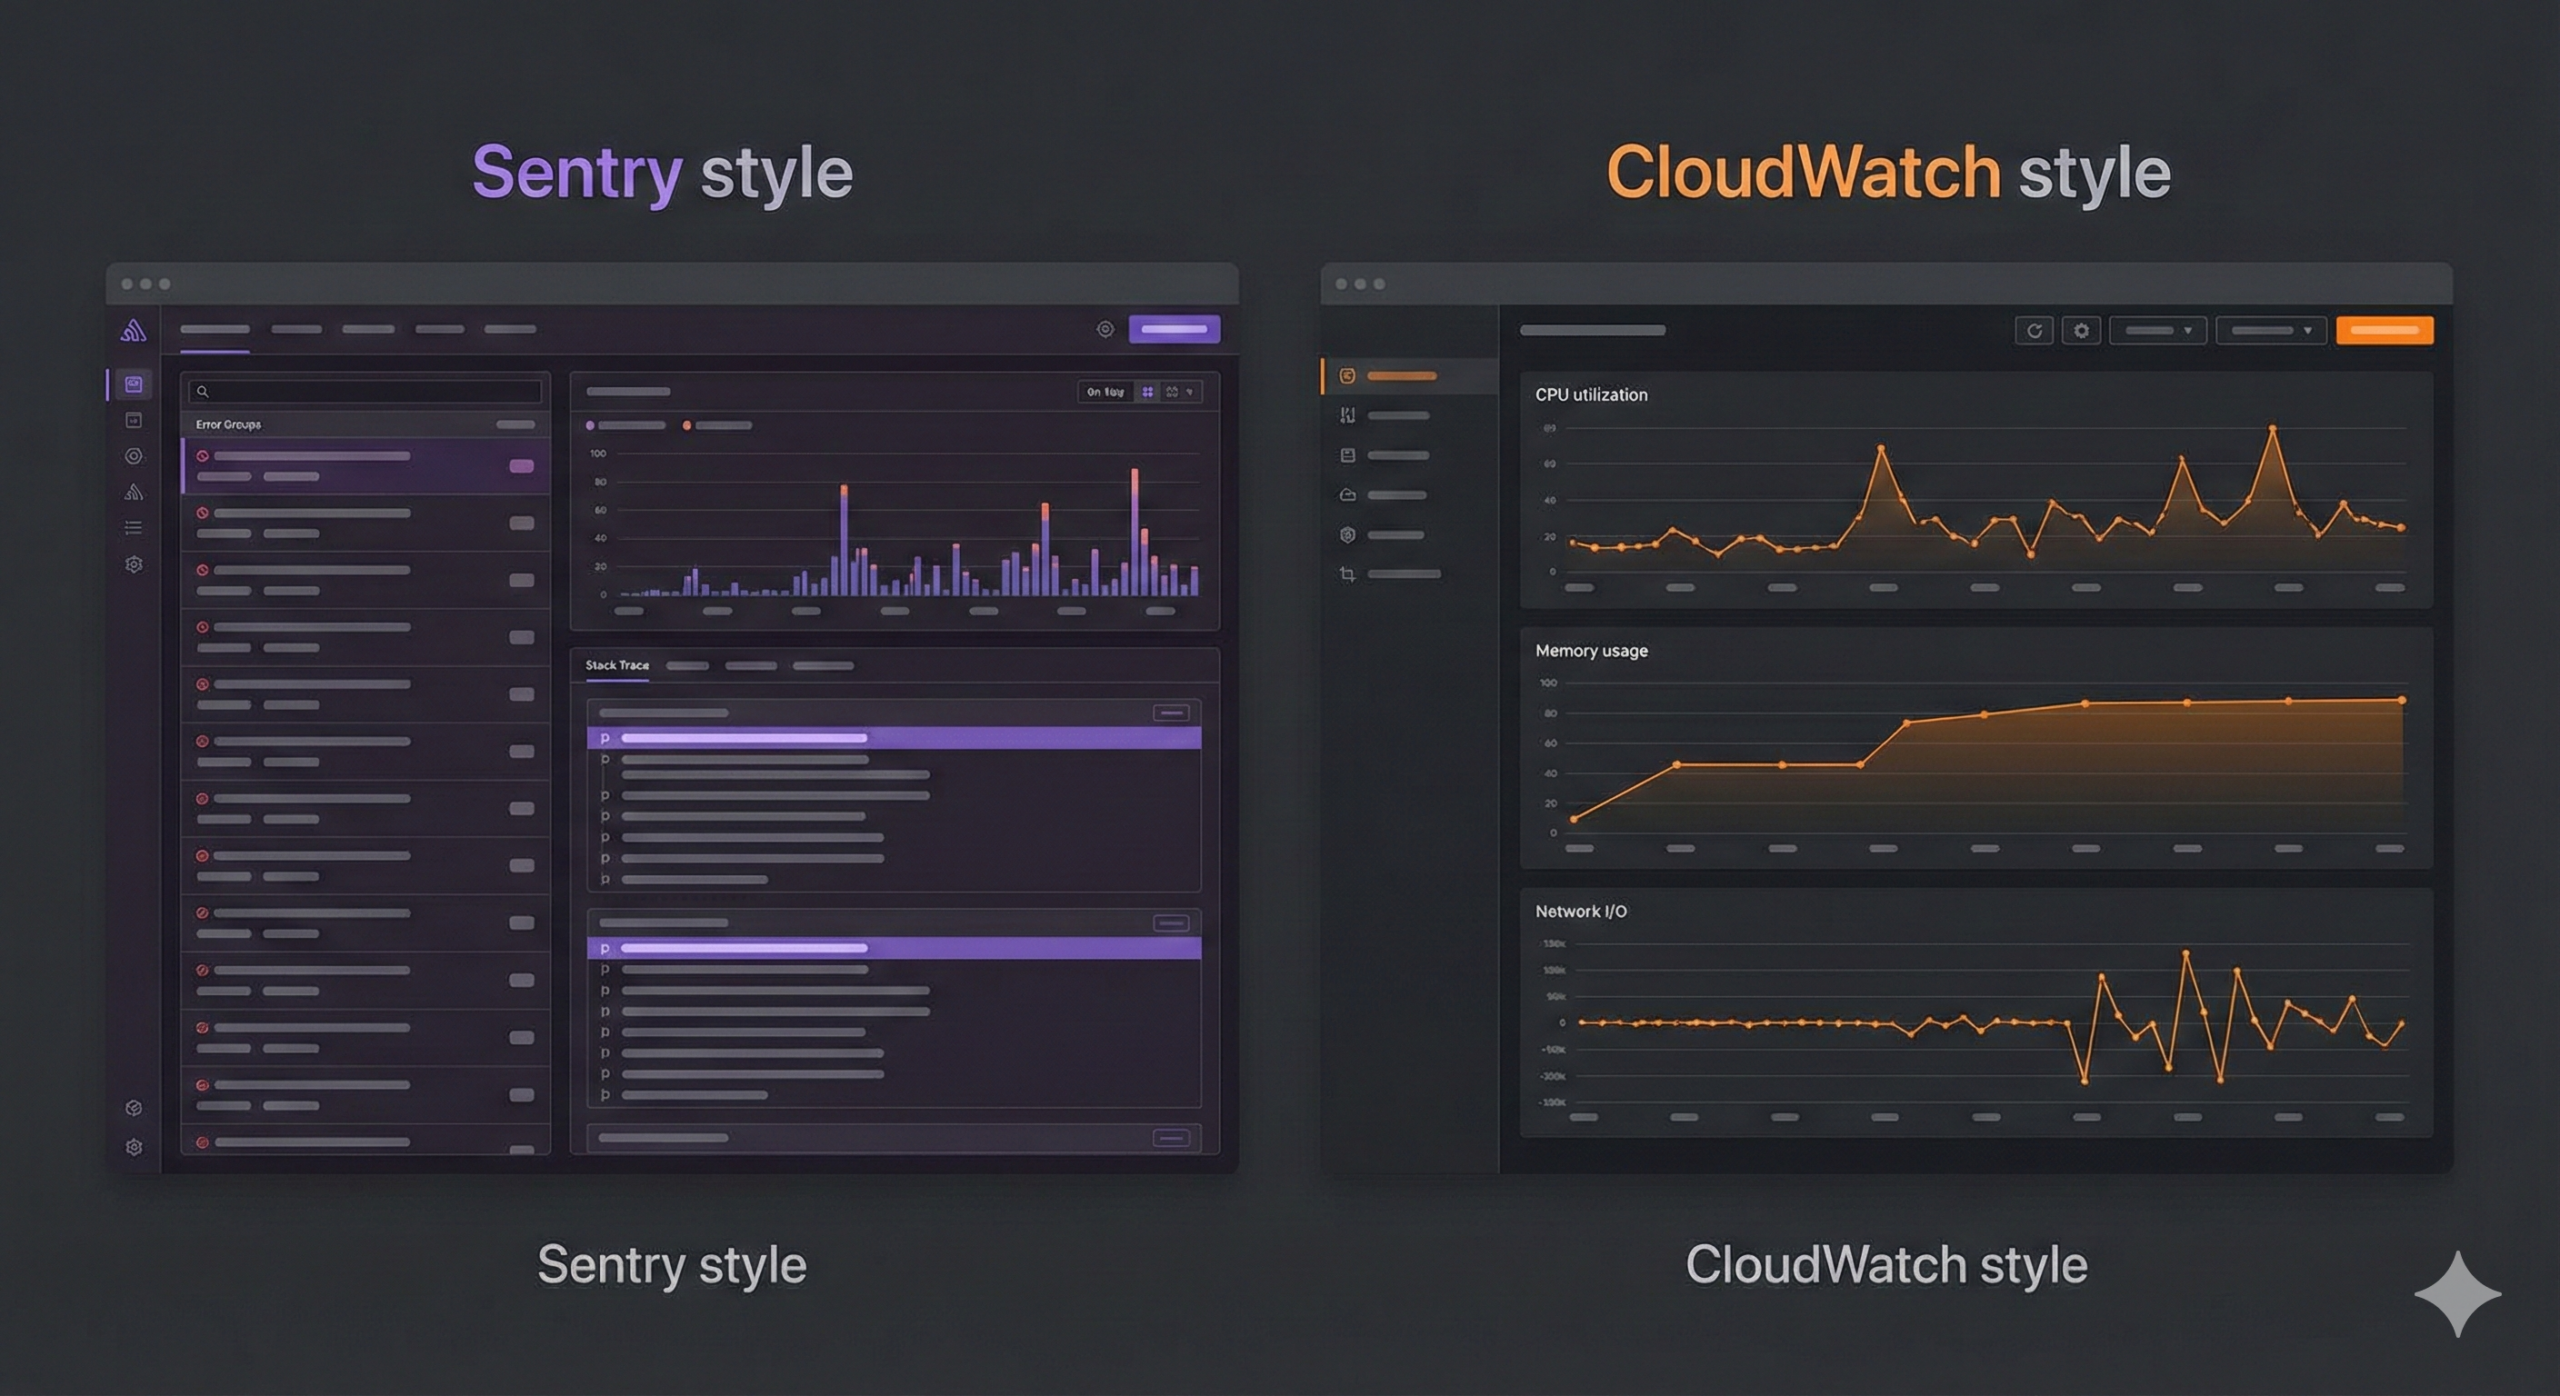
Sentry vs CloudWatch (2026): Complete Comparison for Error Tracking & Monitoring
Choosing between Sentry and Amazon CloudWatch comes down to one question: are you monitoring your application or your infrastructure?
Sentry is a developer-first error tracking tool that catches application-level bugs, crashes, and performance issues with detailed stack traces. CloudWatch is AWS’s native monitoring service that tracks infrastructure metrics, collects logs, and triggers alarms across your entire AWS environment.
The short answer: most production teams use both — Sentry for catching bugs and CloudWatch for watching infrastructure. But if you can only choose one, this guide will help you decide.
Quick Comparison Table
Feature Sentry Amazon CloudWatch Primary focus Application error tracking AWS infrastructure monitoring Error tracking Excellent — stack traces, breadcrumbs, grouping Basic — log pattern matching only Performance monitoring Transaction tracing, web vitals Metrics, custom dashboards Log management Limited (focused on errors) Comprehensive — CloudWatch Logs Alerting Issue-based alerts, Slack/PagerDuty/email Metric alarms, composite alarms, SNS Setup time ~10 minutes (install SDK) Already enabled for AWS services Language support 30+ languages and frameworks Language-agnostic (log-based) AWS integration Via SDK (works anywhere) Native — built into every AWS service Free tier 5K errors/month, 10K transactions 10 custom metrics, 10 alarms, 5GB logs Paid pricing From $26/month (Team plan) Pay-per-use (varies widely) Best for Developers debugging application bugs Ops teams monitoring AWS infrastructure What Is Sentry?
Sentry is an open-source application monitoring platform that specializes in real-time error tracking and performance monitoring. When your code throws an exception, Sentry captures it immediately with the full context: stack trace, user information, browser details, breadcrumbs (the sequence of events that led to the error), and the exact line of code that failed.
What makes Sentry different:
- Automatic error grouping — Sentry intelligently groups similar errors together instead of flooding you with 10,000 duplicate alerts. If the same
TypeErrorhits 500 users, you see one issue with a count of 500. - Stack traces with source code — You see the exact line of code that failed, including the values of local variables at the time of the crash.
- Breadcrumbs — A timeline showing what happened before the error: which API calls were made, which buttons the user clicked, which pages they visited.
- Release tracking — Deploy a new version and Sentry tells you which errors are new, which are fixed, and which regressed.
- Performance monitoring — Track slow transactions, database queries, and API calls. See where your application spends its time.
- Session replay — Watch a video-like reconstruction of what the user saw and did before the error occurred.
Languages and frameworks supported:
JavaScript, TypeScript, React, Next.js, Vue, Angular, Python, Django, Flask, Node.js, Express, Java, Spring, Go, Ruby, Rails, PHP, Laravel, .NET, Rust, Swift, Kotlin, Flutter, React Native, and more — over 30 platforms.
What Is Amazon CloudWatch?
Amazon CloudWatch is AWS’s built-in monitoring and observability service. It collects metrics, logs, and events from virtually every AWS service and provides dashboards, alarms, and automated responses.
What makes CloudWatch different:
- Native AWS integration — CloudWatch is built into AWS. Your EC2 instances, Lambda functions, RDS databases, and S3 buckets automatically send metrics to CloudWatch without installing anything.
- Infrastructure metrics — CPU utilization, memory usage, disk I/O, network traffic, request counts, latency — CloudWatch tracks all of this out of the box for AWS services.
- CloudWatch Logs — A centralized log management system. Application logs, VPC flow logs, Lambda execution logs, and CloudTrail audit logs all go to one place.
- CloudWatch Alarms — Set thresholds on any metric and trigger actions: send an SNS notification, auto-scale an instance group, or run a Lambda function.
- CloudWatch Logs Insights — A query language for searching and analyzing logs. Think of it as SQL for your log data.
- Application Signals — A newer feature that provides application performance monitoring (APM) with auto-instrumentation for Java, Python, and .NET applications.
Services that integrate natively:
EC2, Lambda, RDS, DynamoDB, S3, ECS, EKS, API Gateway, SQS, SNS, Kinesis, Step Functions, CloudFront, Elastic Load Balancing, and virtually every other AWS service.
Sentry vs CloudWatch: Detailed Comparison
Error Tracking
This is where the two tools diverge the most.
Sentry was built specifically for error tracking. When an unhandled exception occurs in your application:
- Sentry captures the full stack trace with source map support
- Groups it with similar errors automatically
- Shows you the exact line of code, the variable values, and the user’s session
- Provides breadcrumbs showing the 20 events that led to the crash
- Tracks which release introduced the error
CloudWatch approaches error tracking differently. It relies on log-based error detection:
- Your application writes errors to stdout/stderr or log files
- CloudWatch Logs collects those log lines
- You create metric filters that match patterns like
"ERROR"or"Exception" - CloudWatch counts occurrences and can trigger alarms
The difference: Sentry gives you “This
TypeError: Cannot read property 'id' of undefinedstarted in release v2.3.1, affects 342 users, happens on the checkout page, and here is the exact code.” CloudWatch gives you “Your application logged 47 lines containing the word ERROR in the last hour.”Winner: Sentry — by a wide margin for application error tracking.
Performance Monitoring
Sentry provides application-level performance monitoring:
- Transaction tracing — See how long each API request takes, broken down by database queries, external API calls, and rendering time
- Web vitals — Track Core Web Vitals (LCP, FID, CLS) that affect your Google search ranking
- Slow query detection — Identify database queries that take too long
- Custom spans — Instrument specific code paths to measure performance
CloudWatch provides infrastructure-level performance monitoring:
- Service metrics — CPU, memory, disk, network for EC2, RDS, Lambda duration, API Gateway latency
- Custom metrics — Push any numeric value from your application
- CloudWatch Application Signals — Newer APM feature with auto-instrumentation (limited language support)
- Container Insights — Monitoring for ECS and EKS clusters
Winner: Depends. Sentry wins for application performance (where in my code is it slow?). CloudWatch wins for infrastructure performance (is my server running out of memory?).
Log Management
Sentry is not a log management tool. It captures error events, not log streams. You can attach breadcrumbs and context to errors, but Sentry is not designed to store and search terabytes of application logs.
CloudWatch Logs is a full-featured log management service:
- Centralized collection from all AWS services
- CloudWatch Logs Insights for searching with a SQL-like query language
- Log retention policies (1 day to 10 years, or indefinite)
- Export to S3 for long-term archival
- Real-time log streaming with subscriptions
Winner: CloudWatch — it is a dedicated log management platform. Sentry does not compete in this category.
Alerting & Notifications
Sentry alerting is issue-based:
- Alert when a new error is detected
- Alert when an error exceeds a frequency threshold (e.g., more than 100 in 5 minutes)
- Alert when an error affects a specific number of users
- Integrations: Slack, PagerDuty, Opsgenie, email, webhooks, Jira, GitHub
CloudWatch alerting is metric-based:
- Alert when a metric crosses a threshold (e.g., CPU > 80% for 5 minutes)
- Composite alarms (combine multiple conditions)
- Actions: SNS notifications, Lambda functions, Auto Scaling, EC2 actions
- Anomaly detection (uses ML to detect unusual patterns)
Winner: Tie. They alert on fundamentally different things. Sentry alerts on application errors. CloudWatch alerts on infrastructure metrics. You likely need both.
Integration & Compatibility
Sentry works anywhere:
- Install via SDK in your application code
- Works on AWS, GCP, Azure, on-premises, or your laptop
- 30+ language SDKs with framework-specific integrations
- Source map upload for minified JavaScript
- GitHub and GitLab integration for linking errors to commits
CloudWatch is AWS-native:
- Automatic metric collection for all AWS services
- CloudWatch agent for custom metrics and logs from EC2
- Works with non-AWS environments via the agent, but that is not its strength
- Tightly integrated with IAM, SNS, Lambda, and Auto Scaling
Winner: Sentry for multi-cloud or non-AWS environments. CloudWatch for AWS-heavy architectures.
Pricing Comparison
Sentry Pricing
Plan Price Includes Developer (Free) $0/month 5K errors, 10K performance transactions, 1 user Team $26/month 50K errors, 100K transactions, unlimited users Business $80/month 50K errors, 100K transactions, advanced features Enterprise Custom Volume discounts, dedicated support Additional usage is billed per event. Sentry offers spike protection to prevent surprise bills from sudden traffic increases.
CloudWatch Pricing
CloudWatch uses pay-per-use pricing that can be complex:
Component Free Tier Paid Rate Custom metrics 10 metrics $0.30/metric/month Alarms 10 alarms $0.10/alarm/month Logs ingested 5 GB/month $0.50/GB Logs stored 5 GB/month $0.03/GB/month Logs Insights queries — $0.005/GB scanned Dashboard 3 dashboards $3/dashboard/month Real-world cost example: A medium-sized application with 20 custom metrics, 15 alarms, 50GB of logs/month, and 2 dashboards costs roughly $35-50/month on CloudWatch. That is comparable to Sentry’s Team plan.
Winner: Sentry for predictable pricing. CloudWatch can get expensive with high log volumes but is “free” if you only use basic AWS service metrics.
Ease of Setup
Sentry setup (~10 minutes):
# Install the SDK
npm install @sentry/nextjs

# Initialize in your app
npx @sentry/wizard@latest -i nextjs
That is it. Sentry auto-detects errors, captures stack traces, and starts sending data immediately. The wizard configures source maps, release tracking, and performance monitoring.
CloudWatch setup (already running):
If you are on AWS, CloudWatch is already collecting basic metrics for your services. No setup needed for default metrics. However, custom metrics, detailed monitoring, and log collection require additional configuration:
- Install the CloudWatch agent on EC2 instances
- Configure log groups and retention policies
- Create metric filters for error detection
- Build dashboards and alarms manually
Winner: Sentry for time-to-first-insight. CloudWatch for zero-config infrastructure metrics.
Dashboard & UI
Sentry has a modern, developer-focused UI:
- Issue list with real-time error counts and trend graphs
- Detailed error pages with stack traces, breadcrumbs, and user context
- Performance dashboards with transaction waterfall views
- Release health tracking with crash-free session rates
- Session replay viewer
CloudWatch has a functional but complex UI:
- Customizable metric dashboards with multiple widget types
- Logs Insights query editor with visualization
- Alarm management interface
- Application Signals dashboard (newer APM feature)
Winner: Sentry — the UI is designed for developers and is significantly more intuitive for debugging. CloudWatch’s UI is powerful but has a steeper learning curve.
When to Use Sentry
Choose Sentry when:
- You are a development team that needs to find and fix bugs fast
- You build web or mobile applications (React, Next.js, Python, Node.js, etc.)
- You want detailed error context — stack traces, breadcrumbs, session replay
- You need to track which release introduced a bug
- Core Web Vitals and frontend performance matter for your SEO
- You deploy to multiple cloud providers or on-premises
- You want to be up and running in under 15 minutes
Sentry is not ideal for: Infrastructure monitoring, server resource tracking, log aggregation, or AWS-specific operational metrics.
When to Use CloudWatch
Choose CloudWatch when:
- You are an ops or DevOps team managing AWS infrastructure
- You need to monitor server health — CPU, memory, disk, network
- You run serverless workloads on Lambda and want execution metrics
- You need centralized log management for compliance or auditing
- You want auto-scaling triggers based on real-time metrics
- Your entire stack is on AWS and you want native integration
- You want anomaly detection on infrastructure metrics
CloudWatch is not ideal for: Application-level error tracking, frontend performance monitoring, or debugging specific code issues.
Can You Use Both Together?
Yes — and most production teams do. Sentry and CloudWatch are complementary, not competing tools.
Here is how they work together:
Scenario CloudWatch Handles Sentry Handles Your API returns 500 errors Tracks the spike in 5xx metrics, triggers an alarm Captures the exact exception, stack trace, and affected users Lambda function times out Logs the timeout, tracks duration metrics Shows which code path caused the timeout and why Database connection pool exhausted Monitors RDS connection count, sends alarm Captures the ConnectionErrorwith the query that failedMemory leak in Node.js Tracks EC2 memory usage trending upward Captures OutOfMemoryErrorwith heap snapshot contextFrontend JavaScript crash Not applicable (CloudWatch is server-side) Captures the error with browser info, user session, and replay The workflow looks like this:
- CloudWatch alarm fires: “5xx error rate exceeded 5% on API Gateway”
- On-call engineer opens Sentry to see what is actually failing
- Sentry shows:
TypeError: Cannot read property 'items' of nullincheckout.js:142, started 20 minutes ago, affects 89 users, introduced in releasev3.2.1 - Engineer rolls back to
v3.2.0, Sentry confirms the error stopped
CloudWatch tells you something is wrong. Sentry tells you what, where, and why.
Sentry vs CloudWatch vs Datadog
Some teams also consider Datadog as an all-in-one alternative. Here is how it compares:
Feature Sentry CloudWatch Datadog Error tracking Excellent Basic Good Infrastructure monitoring None Excellent Excellent APM Good Basic (Application Signals) Excellent Log management Minimal Good Excellent Pricing Affordable ($26+/mo) Pay-per-use Expensive ($15+/host/mo) Setup complexity Low Low (on AWS) Medium Best for Dev teams AWS ops teams Enterprises wanting one tool When to choose Datadog: You want a single platform for infrastructure, APM, logs, and error tracking, and you have the budget. Datadog starts at $15/host/month for infrastructure monitoring, plus additional costs for APM, logs, and error tracking — which can add up quickly for larger deployments.
When to skip Datadog: You are a small-to-medium team and the cost is not justified. Sentry (errors) + CloudWatch (infrastructure) gives you 90% of Datadog’s value at a fraction of the cost.
Frequently Asked Questions
Is Sentry free?
Yes, Sentry offers a free Developer plan that includes 5,000 errors per month, 10,000 performance transactions, and 500 session replays. It is limited to one user, but it is a great way to try Sentry before upgrading. The Team plan starts at $26/month with unlimited users.
Can CloudWatch track application errors?
Sort of. CloudWatch can detect errors in logs using metric filters (matching patterns like “ERROR” or “Exception”), but it does not provide stack traces, error grouping, or debugging context. For true application error tracking, you need a dedicated tool like Sentry.
Is Sentry better than CloudWatch?
They serve different purposes. Sentry is better for application error tracking and debugging. CloudWatch is better for infrastructure monitoring and log management. Most teams use both. Comparing them directly is like comparing a debugger to a server dashboard — they solve different problems.
What is the best monitoring tool for AWS?
For a complete monitoring stack on AWS, we recommend:
- CloudWatch for infrastructure metrics and logs (it is already there)
- Sentry for application error tracking and performance monitoring
- CloudWatch Alarms + SNS for operational alerts
- Sentry Alerts for development/bug alerts
This combination covers infrastructure health, application errors, and performance monitoring without the cost of an all-in-one platform like Datadog.
Can I self-host Sentry?
Yes, Sentry is open-source and can be self-hosted. The self-hosted version is free and includes most features. However, self-hosting requires managing the infrastructure (PostgreSQL, Redis, Kafka, ClickHouse), which is a significant operational burden. Most teams find the hosted version more cost-effective.
Does Sentry affect my application’s performance?
Sentry’s SDK is designed to be lightweight. It adds minimal overhead (~1-5ms per request for performance monitoring). Error capture only runs when an exception occurs. You can configure sample rates to reduce the volume of performance data collected if needed.
Conclusion
Sentry and CloudWatch are not competitors — they are partners in a complete monitoring stack.
- Use CloudWatch to watch your AWS infrastructure: are your servers healthy, are your Lambda functions running, are your logs centralized?
- Use Sentry to watch your application code: are there bugs, which release caused them, which users are affected, and where exactly in the code did things go wrong?
If you are forced to choose one: pick CloudWatch if you are an ops-focused team running serverless workloads entirely on AWS. Pick Sentry if you are a development team shipping features fast and need to catch bugs before your users report them.
But the best answer? Use both. CloudWatch is already running if you are on AWS. Adding Sentry takes 10 minutes and immediately gives you superpowers for debugging production issues.
Need help setting up production-grade monitoring for your application? At Metosys, we specialize in monitoring with Sentry, Prometheus & CloudWatch and real-time metrics and reporting systems. We can design a monitoring stack that catches bugs before your users do. Get in touch to discuss your setup.
Sources:
- Automatic error grouping — Sentry intelligently groups similar errors together instead of flooding you with 10,000 duplicate alerts. If the same
-

Google Genie 3: Everything You Need to Know About DeepMind’s Revolutionary AI World Model
Imagine typing a simple sentence like “a sunny beach with palm trees and gentle waves” and instantly finding yourself inside that world, able to walk around, interact with objects, and watch the environment respond to your actions in real-time. This is no longer science fiction. Google DeepMind’s Genie 3 has made this a reality, representing one of the most significant breakthroughs in artificial intelligence since the emergence of large language models.
In this comprehensive guide, we’ll explore everything you need to know about Genie 3 AI, including how it works, how you can try it yourself, its remarkable features, and why experts believe it could be a crucial stepping stone toward artificial general intelligence (AGI).
What is Genie 3?
Genie 3 is a foundation world model developed by Google DeepMind, officially released on August 5, 2025. Unlike traditional AI systems that generate static images or videos, Genie 3 creates fully interactive, dynamic 3D environments that users can explore and manipulate in real-time. This makes it the first real-time interactive general-purpose world model ever created.
According to Shlomi Fruchter, a research director at DeepMind, “Genie 3 is the first real-time interactive general-purpose world model. It goes beyond narrow world models that existed before. It’s not specific to any particular environment. It can generate both photo-realistic and imaginary worlds.”
The significance of Genie 3 extends far beyond entertainment. DeepMind positions this technology as a critical component in the development of AGI, particularly for training embodied AI agents that need to understand and interact with the physical world. By creating realistic simulations of real-world scenarios, Genie 3 provides a safe and scalable environment for AI systems to learn complex tasks.
Genie 3 Release Date and Development History
The Genie 3 release date was August 5, 2025, marking a major milestone in the evolution of world models. The technology builds upon its predecessors, Genie 1 and Genie 2, as well as DeepMind’s acclaimed video generation model, Veo 3. Each iteration has brought substantial improvements in realism, interactivity, and performance.
Google DeepMind has been working on world models for several years, recognizing their potential to revolutionize how AI systems understand physical reality. The release of Genie 3 coincided with a broader industry shift toward world models, with other major players like Yann LeCun’s AMI Labs entering the space with significant investments.
Following the research release, Google launched Project Genie in early 2026, a consumer-facing prototype that allows users to experience Genie 3’s capabilities firsthand through a web application.
Key Features and Capabilities of Genie 3
Real-Time Interactive Generation
One of the most impressive aspects of Genie 3 is its ability to generate dynamic worlds at 24 frames per second in 720p resolution. Users can navigate these environments in real-time, making decisions and taking actions that the AI responds to instantly. This real-time capability sets Genie 3 apart from previous world models that required pre-rendering or couldn’t handle interactive input.
The environments created by Genie 3 are described as “auto-regressive,” meaning they are generated frame by frame based on the world description and user actions. This approach enables genuine interactivity rather than simply playing back pre-recorded content.
Self-Learned Physics
Perhaps the most remarkable technical achievement of Genie 3 is its physics simulation. Unlike traditional game engines or simulation software that rely on hardcoded physics rules, Genie 3 learned physics through self-supervised learning. This means the AI taught itself how gravity, fluid dynamics, lighting effects, and collision detection work by analyzing vast amounts of real-world data.
The result is environments that feel naturally physical without being explicitly programmed to follow specific rules. Objects fall realistically, water flows naturally, and light behaves as it would in the real world. This emergent understanding of physics represents a significant advancement in AI’s ability to model reality.
Advanced Memory System
Genie 3 features a sophisticated memory system that allows it to remember events and changes for up to one minute. If you move an object, drop something, or make any change to the environment, the AI remembers that modification and maintains consistency as you continue exploring.
This memory capability is crucial for creating coherent experiences. Without it, the world would constantly “forget” your actions, breaking immersion and making meaningful interaction impossible. The system recalls changes from specific interactions for extended periods, enabling coherent sequences of exploration and manipulation.
Photorealistic and Imaginary Worlds
Genie 3 demonstrates remarkable versatility in the types of environments it can create. It can generate photorealistic simulations of real-world locations, from busy city streets to serene natural landscapes. Equally impressive is its ability to create entirely imaginary worlds that have never existed, from fantasy realms to futuristic cityscapes.
This flexibility makes Genie 3 useful across a wide range of applications, from practical training simulations to creative expression and entertainment.
Dynamic Environment Modification
Users can modify Genie 3 environments on the fly through text prompts. Want to change the weather from sunny to rainy? Simply type the command. Need to add new objects or characters to the scene? Genie 3 can incorporate these changes in real-time without requiring a full regeneration of the environment. This promptable world events feature enables dynamic modification of ongoing experiences.
How Genie 3 Works: Technical Deep Dive
Understanding how Genie 3 achieves its remarkable capabilities requires exploring its technical architecture.
Auto-Regressive Frame Generation
Genie 3 environments are generated frame by frame in an auto-regressive manner. Each new frame is created based on three inputs: the original world description, the user’s recent actions, and the memory of previous frames. This approach differs significantly from pre-rendered 3D environments or traditional video generation.
The auto-regressive method allows for genuine interactivity because the system continuously adapts to user input rather than playing back pre-determined content. This is what enables the real-time responsiveness that makes Genie 3 feel so immersive.
Building on Genie 2 and Veo 3
Genie 3 represents an evolution of DeepMind’s earlier work. It builds upon the foundation laid by Genie 2, which introduced the concept of interactive world generation, while incorporating advances from Veo 3, DeepMind’s video generation model. This combination allows Genie 3 to achieve both visual quality and interactivity simultaneously.
Self-Supervised Physics Learning
The physics simulation in Genie 3 emerges from self-supervised learning, an approach where the model learns patterns and relationships from unlabeled data by generating its own learning signals. Rather than being explicitly taught that objects fall downward or that water flows, Genie 3 discovered these principles by observing countless examples of real-world physics in action.
This learned physics proves more flexible and generalizable than hardcoded rules, allowing the system to handle novel situations that might confuse traditional physics engines. The AI essentially developed an intuitive understanding of how the physical world operates.
How to Use Genie 3: A Complete Guide
If you’re wondering how to use Genie 3, there are several ways to experience this groundbreaking technology depending on your location and subscription status.
Project Genie Web App
The most accessible way to try Genie 3 is through Project Genie, Google’s prototype web application built on Genie 3 technology along with Nano Banana Pro and Gemini. This platform allows users to generate and explore short interactive environments from text or image prompts.
The interface is intuitive: describe the world you want to create, and Genie 3 generates it for you to explore. You can move through the AI-generated scenes in real time, experiencing the environment as it responds to your actions.
Currently, Project Genie is available to Google AI Ultra subscribers in the United States who are 18 years or older. While this limits initial access, Google has indicated plans to expand availability over time.
Official DeepMind Demos
Google DeepMind’s official blog post about Genie 3 includes several interactive demos that anyone can try. These demos showcase the technology’s capabilities across different scenarios, including exploring snowy landscapes and navigating museum environments with specific goals.
These Genie 3 demos provide an excellent introduction to the technology’s capabilities without requiring any subscription, making them ideal for those who want to understand what the technology can do before committing to a paid service.
Research Preview Access
For academics, researchers, and select creators, DeepMind offers a limited research preview program. This provides more extensive access to Genie 3’s capabilities for those working on world model research, AI development, or creative applications.
DeepMind announced Genie 3 as a limited research preview, providing early access to a small cohort of academics and creators. While broader access remains limited, the company has expressed interest in expanding access but hasn’t committed to specific timelines.
Genie 3 vs Previous World Models: What’s Different?
Genie 3 represents a significant leap forward compared to previous approaches to world modeling and 3D environment generation.
Compared to Genie 2
While Genie 2 introduced the concept of interactive world generation, Genie 3 improves upon it in several key areas. The newer model offers better visual consistency, more realistic physics, extended memory duration, and true real-time performance. Genie 3 is DeepMind’s first world model to allow interaction in real-time while also improving consistency and realism compared to its predecessor.
Advantages Over NeRFs and Gaussian Splatting
Neural Radiance Fields (NeRFs) and Gaussian Splatting have gained popularity for creating 3D representations from 2D images. However, these approaches create static scenes from existing photographs rather than generating novel content.
Genie 3 environments are far more dynamic and detailed than these methods because they’re auto-regressive—created frame by frame based on the world description and user actions. This enables genuine interactivity and the creation of entirely new environments that never existed.
Real-Time vs Pre-Rendered
Traditional approaches to AI-generated 3D content typically require significant processing time to render each frame or scene. Genie 3’s real-time capability fundamentally changes what’s possible, enabling genuine interactivity and applications that weren’t feasible with pre-rendered content.
Potential Applications of Genie 3 World Models
The applications of Genie 3 world models extend across numerous industries and use cases, from entertainment to scientific research.
Gaming and Entertainment
The most obvious application is in gaming and entertainment. Genie 3 could enable procedurally generated game worlds that respond dynamically to player actions, creating unique experiences for each player. While it’s important to note that Genie 3 is not a game engine and doesn’t include traditional game mechanics, its ability to create immersive, interactive environments opens new possibilities for entertainment.
Education and Training
Educational applications are equally promising. Students could explore historical settings, scientific environments, or abstract concepts in immersive 3D spaces. Training simulations for various professions could be generated on demand, providing realistic practice environments without the cost and logistics of physical simulations.
Robotics and AI Agent Development
DeepMind emphasizes that training AI agents represents perhaps the most significant application of Genie 3. As they state, “We think world models are key on the path to AGI, specifically for embodied agents, where simulating real world scenarios is particularly challenging.”
By creating realistic simulations of real-world scenarios, researchers can train robots and AI systems to handle complex tasks without the risks and costs associated with physical world training. This capability could accelerate the development of general-purpose robots and autonomous systems.
Creative Prototyping
Artists, designers, and creators can use Genie 3 to rapidly prototype concepts and visualize ideas. Architects could walk through buildings before they’re built, filmmakers could scout virtual locations, and game designers could test level concepts instantly.
Current Limitations of Genie 3
Despite its impressive capabilities, Genie 3 has several limitations that users should understand before diving in.
Duration Constraints
Currently, Genie 3 can support a few minutes of continuous interaction rather than extended sessions. Project Genie generations are limited to 60 seconds. While the memory system maintains consistency for up to a minute, longer experiences may encounter inconsistencies or require periodic regeneration.
Limited Action Range
There’s a limited range of actions that agents can carry out within Genie 3 environments. Complex manipulations or highly specific interactions may not work as expected. DeepMind continues to expand the action vocabulary, but current capabilities are still constrained compared to purpose-built game engines.
Multi-Agent Challenges
Accurately modeling interactions between multiple independent agents in shared environments remains an ongoing research challenge. Current implementations handle single-user experiences well but struggle with complex multi-agent scenarios.
Imperfect Real-World Accuracy
While Genie 3 can create convincing environments, it cannot yet simulate real-world locations with perfect accuracy. Generated worlds may contain inconsistencies or inaccuracies when attempting to recreate specific places.
The Future of Genie 3 and World Models
The release of Genie 3 signals a new era in AI development focused on world understanding and simulation. The world models paradigm exploded into mainstream AI development in late 2025 and early 2026, with significant investments flowing into the space.
Yann LeCun’s AMI Labs represents one of the largest bets on world models, raising substantial funding at a multi-billion dollar valuation. This industry-wide interest suggests that world models like Genie 3 represent a fundamental shift in how we approach AI development.
DeepMind and Google continue investing heavily in world model research, recognizing its importance for the future of AI. As the technology matures, we can expect expanded access, improved capabilities, and entirely new applications that we haven’t yet imagined.
Conclusion
Google DeepMind’s Genie 3 represents a genuine breakthrough in artificial intelligence, bringing us closer to AI systems that truly understand and can interact with the physical world. Its ability to generate real-time, interactive 3D environments from simple text prompts opens doors to applications in gaming, education, robotics, and beyond.
The technology’s self-learned physics, advanced memory system, and real-time generation capabilities set a new standard for what world models can achieve. While current limitations around duration and access exist, the trajectory of development suggests these constraints will continue to diminish.
Whether you’re a researcher interested in world models, a developer exploring new possibilities, or simply curious about cutting-edge AI technology, Genie 3 offers a glimpse into a future where the boundaries between imagination and reality become increasingly blurred.
To try Genie 3 yourself, visit Google’s Project Genie through Google Labs if you’re a Google AI Ultra subscriber in the US, or explore the demos available on DeepMind’s official blog. As this technology continues to evolve, we’re witnessing the early stages of a transformation in how we create, explore, and interact with digital worlds.
Sources:
-
What is Moltbot? Complete Guide to Clawdbot AI Setup
In 2025, artificial intelligence has transformed the way we interact with technology. From customer service chatbots to personal productivity assistants, AI-powered automation has become essential for individuals and businesses alike. If you have been searching for a powerful Telegram bot that combines the intelligence of modern AI with seamless automation, you have likely encountered Clawdbot—also known as Moltbot. This comprehensive guide will answer the question what is Moltbot, explore its features, and walk you through everything you need to know about Moltbot AI and how to get started.
What is Moltbot? Understanding the Clawdbot Moltbot Connection
Before diving into the technical details, let’s address one of the most common questions in the community: what is Moltbot, and how does it relate to Clawdbot?
Simply put, Clawdbot Moltbot refers to the same powerful automation tool. The project started under the name Molt (short for “Moltbot”) and later gained the alternative name Clawdbot within certain communities. Whether you search for Moltbot vs Clawdbot or Clawbot Moltbot, you are looking at the same software with identical capabilities.
Moltbot AI is a sophisticated Telegram automation bot that leverages multiple artificial intelligence providers, including Claude (from Anthropic) and OpenAI‘s GPT models. This multi-provider approach gives users flexibility in choosing the AI engine that best suits their needs, whether for conversational chat, content generation, or complex task automation.
The confusion between Clawdbot and Moltbot often arises from community discussions on platforms like Moltbot Reddit threads, where users use the names interchangeably. Some even abbreviate it further to Clawd or simply Clawbot. Regardless of the name you use, the underlying technology remains consistent and powerful.
Key Features of Clawdbot AI: Why Users Choose This Telegram Bot
The popularity of Clawdbot AI stems from its versatile feature set. Unlike single-purpose bots, Moltbot AI combines multiple functionalities into one cohesive platform. Here is what makes it stand out:
1. Multi-AI Provider Support
One of the most significant advantages of Clawdbot AI is its support for multiple AI backends. Users can switch between Claude and OpenAI models depending on their specific requirements:
- Claude: Anthropic’s AI model is known for nuanced, thoughtful responses and strong ethical guidelines. It excels at complex reasoning and detailed explanations.
- OpenAI: The GPT family of models offers broad general knowledge and creative capabilities, making it ideal for content generation and brainstorming.
This flexibility means you are not locked into a single AI ecosystem. As new models emerge, Moltbot AI can integrate them, future-proofing your automation setup.
2. Telegram-Native Integration
Unlike web-based AI tools that require you to open a browser, Clawdbot operates directly within Telegram. This provides several benefits:
- Instant Access: Send a message to your bot and receive AI-powered responses immediately.
- Mobile-Friendly: Use the bot from your phone, tablet, or desktop without switching applications.
- Group Integration: Add the bot to Telegram groups for team collaboration and shared AI assistance.
3. Task Automation and Content Generation
Clawdbot AI goes beyond simple chat. Users leverage it for:
- Automated Responses: Set up triggers and workflows to automate repetitive messaging tasks.
- Content Creation: Generate articles, social media posts, code snippets, and more directly from Telegram.
- Data Processing: Summarize documents, translate text, and analyze information on the fly.
Moltbot Setup: A Complete Installation Guide
Ready to get started? The Moltbot setup process is straightforward, especially if you follow this step-by-step guide. Before you install Moltbot, ensure you have the necessary prerequisites in place.
Prerequisites for Installation
To successfully install Moltbot, you will need:
- A Telegram Account: Create a bot through Telegram’s BotFather to obtain your API token.
- AI API Keys: Register for API access with Claude (Anthropic) and/or OpenAI.
- Docker: The recommended installation method uses Docker for containerized deployment.
- A Server or Local Machine: You can run Moltbot on cloud servers, a home server, or even a Mac Mini.
Moltbot Docker Installation (Recommended)
The Moltbot Docker method is the most popular approach because it simplifies dependency management and ensures consistent behavior across different operating systems. Here is how to deploy using Docker:
Step 1: Install Docker
If you haven’t already, download and install Docker Desktop for your operating system. Verify the installation:
docker --version
docker-compose --version
Step 2: Create Project Directory
Create a dedicated directory for your Moltbot installation:
mkdir moltbot && cd moltbotStep 3: Create docker-compose.yml
Create a
docker-compose.ymlfile with the following configuration:version: '3.8' services: moltbot: image: moltbot/moltbot:latest container_name: moltbot restart: unless-stopped environment: - TELEGRAM_BOT_TOKEN=your_telegram_bot_token - ANTHROPIC_API_KEY=your_claude_api_key - OPENAI_API_KEY=your_openai_api_key - DEFAULT_AI_PROVIDER=claude - LOG_LEVEL=info volumes: - ./data:/app/data - ./config:/app/config ports: - "3000:3000"Step 4: Create Environment File
For better security, create a
.envfile to store your API keys:# .env file TELEGRAM_BOT_TOKEN=123456789:ABCdefGHIjklMNOpqrsTUVwxyz ANTHROPIC_API_KEY=sk-ant-api03-xxxxxxxxxxxxx OPENAI_API_KEY=sk-xxxxxxxxxxxxxxxxxxxxx DEFAULT_AI_PROVIDER=claude LOG_LEVEL=infoStep 5: Launch the Container
Start Moltbot Docker with a single command:
docker-compose up -dStep 6: Verify the Installation
Check that the container is running:
docker ps
docker logs moltbot
Send a test message to your bot on Telegram to confirm everything is working.
The beauty of the Docker approach is portability. Whether you are running Moltbot Windows, macOS, or Linux, the containerized environment behaves identically.
Moltbot npm Alternative
For developers who prefer Node.js environments, Moltbot npm provides an alternative installation path. This method is particularly useful if you want to customize the bot’s behavior or integrate it into an existing Node.js application.
Step 1: Verify Node.js Installation
Ensure Node.js (version 18 or higher) is installed:
node --version  # Should be v18.0.0 or higher
npm --version
Step 2: Create Project Directory
mkdir moltbot-app && cd moltbot-app
npm init -y
Step 3: Install Moltbot Package
Install Moltbot npm and its dependencies:
npm install moltbot
npm install dotenv
Step 4: Create Configuration File
Create a
.envfile in your project root:# .env TELEGRAM_BOT_TOKEN=your_telegram_bot_token ANTHROPIC_API_KEY=your_claude_api_key OPENAI_API_KEY=your_openai_api_key DEFAULT_PROVIDER=claudeStep 5: Create Entry Point
Create an
index.jsfile:require('dotenv').config(); const { MoltBot } = require('moltbot'); const bot = new MoltBot({ telegramToken: process.env.TELEGRAM_BOT_TOKEN, anthropicKey: process.env.ANTHROPIC_API_KEY, openaiKey: process.env.OPENAI_API_KEY, defaultProvider: process.env.DEFAULT_PROVIDER || 'claude', }); bot.start(); console.log('Moltbot is running...');Step 6: Run the Application
node index.jsOptional: Add to package.json Scripts
{
  "scripts": {
    "start": "node index.js",
    "dev": "nodemon index.js"
  }
}
Moltbot Windows Setup
Running Moltbot Windows is straightforward with Docker Desktop for Windows. Here’s a complete setup guide:
Step 1: Enable WSL2
Open PowerShell as Administrator and run:
wsl --install
wsl --set-default-version 2
Restart your computer after installation.
Step 2: Install Docker Desktop
Download Docker Desktop for Windows and ensure WSL2 backend is enabled in Settings > General.
Step 3: Create Project Folder
Open PowerShell and create your project directory:
mkdir C:\moltbot
cd C:\moltbot
Step 4: Create Configuration Files
Create
docker-compose.ymlusing PowerShell:New-Item -ItemType File -Name "docker-compose.yml" notepad docker-compose.ymlStep 5: Configure Windows Firewall
Allow Docker through Windows Firewall:
New-NetFirewallRule -DisplayName "Docker" -Direction Inbound -Action Allow -Protocol TCP -LocalPort 3000Step 6: Launch Moltbot
docker-compose up -d
docker logs -f moltbot
Optional: Auto-Start on Boot
Create a scheduled task to start Moltbot Windows automatically:
schtasks /create /tn "MoltbotStartup" /tr "docker-compose -f C:\moltbot\docker-compose.yml up -d" /sc onstart /ru SYSTEMMoltbot Mac Mini: The Perfect Home Server
The Mac Mini has become a popular choice for running always-on services like Moltbot. Its compact size, low power consumption, and reliable macOS environment make it ideal for home automation enthusiasts.
Step 1: Install Homebrew and Docker
Open Terminal and install the prerequisites:
# Install Homebrew
/bin/bash -c "$(curl -fsSL https://raw.githubusercontent.com/Homebrew/install/HEAD/install.sh)"

# Install Docker Desktop
brew install --cask docker
Step 2: Disable Sleep Mode
Prevent your Mac Mini from sleeping to keep Moltbot running 24/7:
# Disable sleep entirely
sudo pmset -a disablesleep 1

# Or use caffeinate for the Docker process
caffeinate -i docker-compose up -d
Step 3: Create Project Directory
mkdir ~/moltbot && cd ~/moltbotStep 4: Create docker-compose.yml
cat << 'EOF' > docker-compose.yml
version: '3.8'
services:
  moltbot:
    image: moltbot/moltbot:latest
    container_name: moltbot
    restart: always
    env_file:
      - .env
    volumes:
      - ./data:/app/data
EOF
Step 5: Configure Environment Variables
cat << 'EOF' > .env
TELEGRAM_BOT_TOKEN=your_token_here
ANTHROPIC_API_KEY=your_claude_key
OPENAI_API_KEY=your_openai_key
DEFAULT_AI_PROVIDER=claude
EOF
Step 6: Launch and Enable Auto-Start
# Start Moltbot
docker-compose up -d

# Create LaunchAgent for auto-start on boot
cat << EOF > ~/Library/LaunchAgents/com.moltbot.startup.plist
<?xml version="1.0" encoding="UTF-8"?>
<!DOCTYPE plist PUBLIC "-//Apple//DTD PLIST 1.0//EN" "http://www.apple.com/DTDs/PropertyList-1.0.dtd">
<plist version="1.0">
<dict>
    <key>Label</key>
    <string>com.moltbot.startup</string>
    <key>ProgramArguments</key>
    <array>
        <string>/usr/local/bin/docker-compose</string>
        <string>-f</string>
        <string>$HOME/moltbot/docker-compose.yml</string>
        <string>up</string>
        <string>-d</string>
    </array>
    <key>RunAtLoad</key>
    <true/>
</dict>
</plist>
EOF

launchctl load ~/Library/LaunchAgents/com.moltbot.startup.plist
The Moltbot Mac Mini combination is particularly popular in the Moltbot Reddit community, where users share optimization tips and configuration examples.
Getting Started with GitHub: Clawdbot and Moltbot Repositories
The official source code and documentation for the project are hosted on GitHub. Whether you search for GitHub Moltbot or GitHub Clawdbot, you will find comprehensive resources to help you get started.
Finding the GitHub Repository
The GitHub Moltbot repository contains:
- Source Code: The complete codebase for developers who want to customize or contribute.
- Documentation: Detailed guides covering installation, configuration, and advanced usage.
- Issues and Discussions: A community forum for reporting bugs and requesting features.
- Release Notes: Changelog documenting new features and fixes in each version.
When browsing GitHub Clawdbot resources, pay attention to the README file, which provides quick-start instructions and links to more detailed documentation.
Cloning and Configuration
To set up from GitHub, follow these developer steps:
Step 1: Clone the Repository
git clone https://github.com/moltbot/moltbot.git
cd moltbot
Step 2: Install Dependencies
npm installStep 3: Configure Environment
# Copy the example configuration
cp .env.example .env

# Edit with your preferred editor
nano .env  # or code .env for VS Code
Step 4: Configure Your API Keys
Update the
.envfile with your credentials:# Telegram Configuration TELEGRAM_BOT_TOKEN=123456789:ABCdefGHIjklMNOpqrsTUVwxyz # AI Provider Keys ANTHROPIC_API_KEY=sk-ant-api03-xxxxxxxxxxxxx OPENAI_API_KEY=sk-xxxxxxxxxxxxxxxxxxxxx # Default Settings DEFAULT_AI_PROVIDER=claude AI_MODEL=claude-3-opus-20240229 MAX_TOKENS=4096 TEMPERATURE=0.7Step 5: Build and Run
# Development mode with hot reload
npm run dev

# Production build
npm run build
npm start
Step 6: Run Tests (Optional)
npm run test
npm run lint
The GitHub repository is regularly updated with improvements. Watch the repository for notifications:
# Stay updated with the latest changes
git pull origin main
npm install
npm run build
Platform Compatibility: Running Moltbot Anywhere
One of the strengths of Clawdbot Moltbot is its cross-platform compatibility. Thanks to Docker containerization, the bot runs consistently across different operating systems.
Moltbot Windows Considerations
As mentioned earlier, Moltbot Windows users should:
- Use Docker Desktop with WSL2 backend for best performance.
- Configure Windows to allow the bot to run in the background.
- Consider using Windows Task Scheduler for automatic startup.
Moltbot Mac Mini Optimization
The Mac Mini offers excellent value for running Moltbot 24/7. Key optimization tips include:
- Disable automatic sleep in System Preferences.
- Use Docker’s resource limits to prevent excessive memory usage.
- Set up monitoring to alert you if the bot goes offline.
Linux Server Deployment
For production deployments, Linux servers offer the most robust environment. Here’s a complete Moltbot Docker setup for Ubuntu/Debian:
Step 1: Install Docker on Linux
# Update package index
sudo apt update

# Install Docker
sudo apt install -y docker.io docker-compose

# Add your user to docker group
sudo usermod -aG docker $USER

# Start Docker service
sudo systemctl enable docker
sudo systemctl start docker
Step 2: Create Moltbot Directory
sudo mkdir -p /opt/moltbot
sudo chown $USER:$USER /opt/moltbot
cd /opt/moltbot
Step 3: Create Systemd Service
Create a systemd service for automatic restarts and boot startup:
sudo cat << 'EOF' > /etc/systemd/system/moltbot.service
[Unit]
Description=Moltbot Telegram AI Bot
Requires=docker.service
After=docker.service

[Service]
Type=oneshot
RemainAfterExit=yes
WorkingDirectory=/opt/moltbot
ExecStart=/usr/bin/docker-compose up -d
ExecStop=/usr/bin/docker-compose down
TimeoutStartSec=0

[Install]
WantedBy=multi-user.target
EOF

# Enable and start the service
sudo systemctl daemon-reload
sudo systemctl enable moltbot
sudo systemctl start moltbot
Step 4: Monitor Logs
# View real-time logs
docker logs -f moltbot

# Check service status
sudo systemctl status moltbot
Community and Support: Moltbot Reddit and Beyond
No software thrives without a supportive community. The Moltbot Reddit community on Reddit is one of the most active spaces for discussion, troubleshooting, and sharing creative use cases.
What You’ll Find on Moltbot Reddit
Browsing Moltbot Reddit threads reveals:
- Setup Guides: User-contributed tutorials for specific platforms and configurations.
- Use Case Examples: Creative ways people use Clawdbot AI in their daily lives.
- Troubleshooting Help: Community members helping each other solve technical issues.
- Feature Requests: Discussions about desired functionality and roadmap priorities.
Other Community Resources
Beyond Reddit, you can find support through:
- GitHub Issues: For bug reports and technical problems on GitHub.
- Discord Servers: Real-time chat with other Moltbot users on Discord.
- Telegram Groups: Fitting for a Telegram bot, there are dedicated groups for user discussion.
Moltbot vs Clawdbot: Clearing Up the Confusion
By now, you understand that the Moltbot vs Clawdbot question has a simple answer: they are the same tool. However, let’s address why this confusion persists and clarify the various names you might encounter.
The Name Evolution
The project originated as Molt, a reference to the process of shedding and renewal. As the community grew, the name Moltbot became standard for referring to the bot specifically. The alternative name Clawdbot emerged as a playful nod to one of its supported AI providers, Claude.
Common Name Variations
Name Context Notes Moltbot Official name Most common in documentation Clawdbot Community name Popular in Reddit discussions Clawbot Abbreviated Casual shorthand Clawd Abbreviated Very informal reference Molt Original project name Still used in some contexts When searching online, using any of these terms—Clawdbot, Moltbot, Clawbot, Clawd, or Molt—should lead you to relevant results.
Advanced Configuration: Getting the Most from Clawdbot AI
Once you have completed the basic Moltbot setup, you can explore advanced configurations to enhance your experience.
Customizing AI Behavior
Clawdbot AI allows you to customize how the AI responds:
- System Prompts: Define the AI’s personality and response style.
- Model Selection: Choose between Claude and OpenAI models for different tasks.
- Temperature Settings: Adjust creativity levels for responses.
- Context Management: Configure how much conversation history the AI considers.
Automation Workflows
Power users leverage Moltbot AI for complex automation:
- Scheduled Tasks: Set up recurring AI-powered messages or reports.
- Trigger-Based Actions: Respond automatically to specific keywords or patterns.
- Integration with Other Services: Connect to webhooks and external APIs.
Conclusion: Start Your Clawdbot Moltbot Journey Today
We have covered substantial ground in this guide, from understanding what is Moltbot to walking through the complete Moltbot setup process. Whether you call it Clawdbot, Moltbot, Clawbot, or simply Clawd, this powerful Telegram automation tool offers unmatched flexibility with its support for both Claude and OpenAI.
The Moltbot Docker installation method makes deployment straightforward across Moltbot Windows, Moltbot Mac Mini, and Linux environments. For developers, the Moltbot npm option provides additional customization possibilities, while the GitHub Moltbot and GitHub Clawdbot repositories offer comprehensive documentation and community support.
As you begin your journey with Clawdbot Moltbot, remember that the Moltbot Reddit community and GitHub issues are excellent resources for troubleshooting and inspiration. The future of AI automation is here, and with Clawdbot AI running on your Telegram, you are well-equipped to harness its power.
Ready to install Moltbot? Head to GitHub, clone the repository, and follow the Moltbot setup guide. In just a few minutes, you will have a fully functional AI assistant at your fingertips, available anytime through Telegram.
-

Why Every Modern Application Needs a Digital Detective
Have you ever been navigating a critical application, and suddenly—POOF—it just stops working? Maybe the screen freezes, or a process fails silently in the background. These technical failures, or bugs, are like invisible friction points that crawl into the codebase and disrupt the user experience.
For developers, identifying the root cause of these issues in a production environment is like playing a game of Where’s Waldo?—except Waldo is invisible and hiding within millions of lines of distributed code. This is where Sentry comes into play.
In this comprehensive guide, we will explore why Sentry is considered the gold standard for error tracking, and we will compare it against industry heavyweights like AWS CloudWatch, Splunk, and Google Analytics. Whether you are managing a small startup or a global enterprise, choosing the right “digital detective” is critical for your 2025 technology roadmap.
Sentry Working: How the Digital Detective Pinpoints Errors
To understand sentry working, imagine your application as a complex machine. Every time a component fails or a calculation goes wrong, a specialized “watchdog” (Sentry) immediately records the state of the machine and alerts the maintenance team.
1. The Super-Secret SDK (The Monitor)
First, developers integrate a lightweight library into their application, known as an SDK. Think of this as giving your codebase a nervous system. This monitor doesn’t track private user behavior; it strictly watches the code execution. When the application encounters an unhandled exception, the SDK intercepts the data before the session ends.
2. The Information Payload (The Event)
When an error occurs, Sentry captures an “event.” This is similar to a detective collecting a detailed report from a crime scene. Inside this event, Sentry includes:
- The Stack Trace: A chronological map of every function call leading up to the crash.
- The Context: Metadata about the environment, such as browser version, OS, and release version.
- The Impact: Sentry quantifies how many unique users are affected by the issue.
3. The Centralized Dashboard
All captured events are sent to Sentry’s centralized platform. Rather than showing a raw list of logs, Sentry uses “fingerprinting” to group identical errors into single “Issues.” This prevents noise and allows developers to prioritize the most critical failures first.
By observing sentry working in real-time, engineering teams can shift from reactive firefighting to proactive resolution, fixing bugs before they spiral into system-wide outages.
Sentry vs AWS CloudWatch: The Specific Specialist vs. The General Guard
One of the most frequent debates in the DevOps world is sentry vs aws cloudwatch.
Imagine managing a high-rise skyscraper.
- AWS CloudWatch is the Building Security Team. They monitor the elevators, the HVAC systems, the electrical grid, and the external perimeter. They ensure the overall infrastructure (the skyscraper) is healthy.
- Sentry is the Internal Monitor focused on specific rooms. It doesn’t care about the elevators; it cares if a specific faucet is leaking or if a lightbulb in room 402 has burned out.
Sentry vs AWS CloudWatch: The Key Differences
When evaluating sentry vs aws cloudwatch, you are essentially choosing between infrastructure monitoring and application-level code monitoring.
- AWS CloudWatch excels at infrastructure health: “The server CPU is at 99%!” or “The database is running slow.”
- Sentry excels at code-level logic errors: “This specific function failed for users in the checkout flow.”
Modern enterprises typically use both. CloudWatch monitors the “host” (your AWS resources), while Sentry monitors the “guest” (your application code).
Sentry vs AWS: Platform vs. Tool
When discussing sentry vs aws, it’s important to remember that AWS is a vast cloud ecosystem offering hundreds of services. Sentry is a specialized, best-in-class tool for a single purpose: error management.
While AWS offers logging tools (CloudWatch Logs), they are often raw and require significant manual filtering. Sentry transforms that raw data into actionable intelligence, providing a developer experience that a general-purpose cloud provider struggles to match.
Sentry vs CloudWatch RUM: User Experience vs. Network Health
AWS offers a specialized feature called RUM (Real User Monitoring). When comparing sentry vs cloudwatch rum, it’s helpful to distinguish between how a user moves through your app and why their experience broke.
- CloudWatch RUM is like a satellite view. It tracks page load times, geographical latencies, and “User Journeys.” It tells you that a user in Berlin is experiencing slow performance.
- Sentry is like a BlackBox recorder. It doesn’t just see the slowness; it captures the specific function call or API timeout that caused it.
If your goal is to optimize the global speed of your website, CloudWatch RUM is an excellent choice. However, if your goal is to minimize time-to-fix for code regression, Sentry is the clear winner. In the sentry vs cloudwatch rum showdown, Sentry provides the “why” while RUM provides the “where.”
Sentry vs CloudWatch Reddit: The Developer Consensus
If you browse tech communities like Reddit, you will find heated discussions regarding sentry vs cloudwatch reddit.
A common sentiment on Reddit is that while CloudWatch is comprehensive, it is notoriously “noisy” and lacks a cohesive user interface (UI). One user might say, “I use CloudWatch because we are already on the AWS stack,” while another responds, “Sentry’s UI allows my team to solve in 5 minutes what took 2 hours in CloudWatch Logs.”
The community consensus on sentry vs cloudwatch reddit generally follows these three points:
- Setup Speed: Sentry is considered “plug-and-play,” whereas CloudWatch often requires complex IAM roles and log group configurations.
- Context: Sentry provides source-mapped stack traces out of the box; CloudWatch often leaves you staring at minified production logs.
- Alerting: CloudWatch alerts are great for infrastructure (e.g., “CPU high”), but Sentry alerts are actionable for developers (e.g., “Database timeout on line 42”).
Ultimately, the sentry vs cloudwatch reddit threads suggest a hybrid approach: Use CloudWatch for system health and Sentry for application-level observability.
Sentry vs Application Insights: Ecosystem Lock-in vs. Portability
For teams operating within the Microsoft ecosystem, the comparison is often sentry vs application insights.
- Application Insights (part of Azure Monitor) is deeply integrated with the .NET and Azure stack. It offers excellent “autodiscovery” for Microsoft services.
- Sentry is an agnostic detective. It works seamlessly across Azure, GCP, AWS, and on-premise environments.
The choice in sentry vs application insights often comes down to portability. If you ever plan to move part of your stack out of Azure, Sentry’s cross-platform nature ensures your observability doesn’t break. Furthermore, many developers find Sentry’s focus on “Issue grouping” to be superior to the raw telemetry viewing in Application Insights.
Sentry vs Splunk: Tactical Triage vs. Enterprise Auditing
Finally, let’s look at sentry vs splunk. This is a comparison between a scalpel and a chainsaw.
- Splunk is a “Data Giant.” It is designed to ingest massive volumes of machine data for security auditing, compliance, and historical analysis. It excels at answering retrospective questions: “Who accessed this file six months ago?”
- Sentry is an “Actionable Triage” tool. It doesn’t care about your historical login logs; it cares about the crash that is happening right now.
In the sentry vs splunk debate, companies often find that Splunk is too expensive and slow for simple error tracking. Sentry is built to help a developer fix a bug in minutes. Splunk is built to help a data analyst find patterns over weeks.
Sentry vs Google Analytics: Engagement vs. Stability
A prevalent misconception in the industry is that a website with traffic analytics doesn’t need error monitoring. This brings us to the sentry vs google analytics comparison.
Consider the operation of an E-commerce Platform.
- Google Analytics is your window into user behavior. It tracks conversion rates, referral sources, and popular products. It’s essential for understanding who your customers are and what they are doing.
- Sentry is your window into application stability. It monitors the “buy” button, the checkout API, and the payment gateway integration. It tells you why a customer cannot complete their purchase.
In the world of sentry vs google analytics, these tools are complementary. Google Analytics might report a high bounce rate on your checkout page, but without Sentry, you won’t know if users are leaving because the price is too high or because the checkout script is crashing.
Sentry Self Hosted Pricing: The Cost of Ownership vs. Convenience
For teams looking to optimize their budget, the question of cost is paramount. When researching sentry self hosted pricing, it is vital to look beyond the $0 price tag of the software license.
The Self-Hosted Reality (On-Premise)
Sentry is an open-source project, meaning you can host the core platform on your own infrastructure for free. However, “free” often refers to the license, not the total cost of ownership (TCO).
Key considerations for sentry self hosted pricing include:
- Infrastructure Costs: Sentry depends on multiple heavy-duty services (PostgreSQL, Clickhouse, Kafka, Redis). Running these reliably in the cloud typically costs between $50 and $250 per month in compute and storage.
- Maintenance Overhead: When you host Sentry, you are responsible for upgrades, security patches, and database scaling. This often requires several hours of DevOps time per month.
- Feature Gatekeeping: While Sentry maintains high parity between its SaaS and self-hosted versions, certain advanced AI features and mobile symbolication services are proprietary and exclusive to the SaaS offering.
Ultimately, the decision on sentry self hosted pricing depends on your team’s size. Small teams usually save money and time by using Sentry’s SaaS tier, while giant enterprises with existing Kubernetes clusters might find value in self-hosting.
Sentry Rate and Quotas: Managing Ingestion Flow
The final technical concept to master is the sentry rate. This refers to the volume of events your application sends to the monitoring platform.
In a high-traffic environment, a single recursive bug can trigger millions of errors in seconds. If your sentry rate is not managed properly, two things happen:
- Quota Exhaustion: You might hit your monthly plan limit within hours.
- Dashboard Noise: Your “Issues” list becomes impossible to parse due to the sheer volume of identical events.
Developers manage the sentry rate through “Sampling.” By setting a sample rate (e.g., 10%), Sentry only ingests one out of every ten events. This provides enough statistical data to identify patterns without blowing your budget or overwhelming your engineers.
Conclusion: Crafting Your Observability Strategy
We have covered a significant amount of ground, from comparing sentry vs cloudwatch rum to deconstructing the hidden costs of sentry self hosted pricing.
The most important takeaway is that observability is not a “one size fits all” solution. Leading engineering teams often adopt a multi-tool approach:
- AWS CloudWatch for infrastructure-level health.
- Google Analytics for product and marketing insights.
- Sentry for code-level stability and rapid bug resolution.
If you are just starting out, prioritize Sentry. Its developer-first approach and the transparency of its sentry working model make it the most effective tool for maintaining high application quality. By integrating Sentry today, you are not just tracking errors—you are investing in a better experience for your users.
Advanced Observability Strategies
Once you have mastered the basics of comparing sentry vs aws cloudwatch, you can begin implementing advanced strategies to further harden your application.
1. AI-Powered Root Cause Analysis
In 2025, Sentry introduced advanced AI capabilities that go beyond simple error reporting. The platform can now analyze a crash and suggest specific code fixes (Source Map awareness). This is a primary differentiator when evaluating sentry vs aws—while AWS provides the data, Sentry provides the answer.
2. Ecosystem Integration
A key advantage of Sentry is its ability to integrate with your existing developer workflow. By connecting Sentry to tools like Slack, Microsoft Teams, or GitHub, your engineering team receives real-time notifications about regressions. This reduces the “mean time to resolution” (MTTR) far more effectively than manually searching through logs in sentry vs splunk.
The Ultimate “Which Tool Should I Choose?” Checklist
Are you still confused? Don’t worry! Here is a simple checklist to help you decide which superhero tool belongs in your digital treehouse:
If your primary goal is to… Use this tool! Reason for selection Debug code-level production crashes Sentry Direct mapping to source code and line numbers. Monitor server CPU and infrastructure AWS CloudWatch Native integration with AWS resource health. Understand user interaction latencies CloudWatch RUM Excellent for tracking frontend performance metrics. Use the community-preferred tool Sentry High developer sentiment on Reddit for UI/UX. Standardize on the Microsoft stack Application Insights Frictionless integration with .NET/Azure. Perform deep security/compliance audits Splunk Unmatched capacity for massive log ingestion. Track marketing and user funnel data Google Analytics The industry standard for behavior analytics. Glossary of Key Terms
To solidify your understanding of sentry working and the broader observability landscape, keep this glossary handy:
- SDK (Software Development Kit): A lightweight library integrated into your code to monitor execution.
- Event: A single unit of data representing a crash, error, or performance transaction.
- SaaS (Software as a Service): A hosted model where Sentry manages the infrastructure for you.
- Self-Hosted: On-premise deployment where you manage the database and compute resources.
- Infrastructure: The underlying hardware and cloud services (AWS, Azure) that host your app.
- Log: A historical record of system events, often used for post-mortem analysis.
- Sampling: The process of capturing a percentage of data to manage costs and noise.
Final Thoughts: Building a Resilient Future
In 2025, the barrier between success and failure is often the speed at which a team can identify and resolve technical debt. By understanding the nuances of sentry vs cloudwatch rum, evaluating sentry self hosted pricing objectively, and acknowledging the strengths of sentry vs application insights, you are empowered to make a data-driven decision.
Start small, focus on the errors that impact your users most, and leverage the transparency of sentry working to build more reliable software.
-

How AI Reads Insurance Papers: A Guide to Intelligent Document Processing
Imagine you have a giant mountain of homework. It is taller than your house! Every page is different. Some are typed neatly, some have messy handwriting, and some have coffee stains on them. Your teacher says, “You must read all of this and type it into the computer by tomorrow, or you fail!”
Scary, right? well, this is exactly what big insurance companies in the USA deal with every single day. They get millions of papers—forms, medical reports, letters, and emails. In the past, they had to hire thousands of people to sit at desks and read these papers one by one. It was boring, slow, and expensive.
But now, they have a secret weapon. It is called Intelligent Document Processing (IDP). It is like a super-smart robot that can read faster than any human. Let’s learn how this Digital Transformation in Insurance is changing everything!
1. The Big Problem: Too Much Paper!
In America, when you want to insure your car or your house, you have to fill out forms. When you have an accident (like a tree falling on your roof), you send in pictures and bills. All of these are “documents.”
For a long time, insurance companies were buried under a “Paper Mountain.” Because people are slow at reading and typing, everything took a long time.
Think about it: If your car gets dented, you want it fixed now. You don’t want to wait three weeks because someone at the insurance company hasn’t read your email yet.That is why Insurance Digitisation is so important. It means turning that paper mountain into digital data that computers can understand instantly.
2. What is Intelligent Document Processing (IDP)?
You might ask, “Can’t computers already read?” Well, sort of.
The Old Way: OCR (The Eye)
There is an old technology called OCR for insurance (Optical Character Recognition). Think of OCR like a camera. It can take a picture of a page and say, “I see letters here.” But it doesn’t understand what it is reading. If it sees the number “1000,” it doesn’t know if that is dollars, a year, or the number of cats you own.
The New Way: IDP (The Brain)
Intelligent Document Processing (IDP) is different. It uses Artificial Intelligence (AI). It doesn’t just see the letters; it understands them.
Analogy: If OCR is like a parrot that repeats words without knowing what they mean, IDP is like a smart student who reads a story and can answer questions about it.When AI in document processing insurance looks at a messy form, it says:
“Aha! This number ‘1000’ is in the box that says ‘Total Cost’, so it must be money!”
This understanding makes insurance document processing super fast and smart.3. The Tech Team: The Eyes, The Brain, and The Hands
To make this magic happen, insurance companies use a team of three computer friends. We call this the “Tech Stack.”
1. The Eyes (OCR)
First, the computer needs to “see” the paper. It turns the scanned image into text. This is the first step.
2. The Brain (AI & Machine Learning)
This is the smart part. It looks at the text and figures out what is important.
It uses **Natural Language Processing (NLP)**. This is how computers understand human language. It knows that “John Smith” is a person’s name and “New York” is a place. It’s like teaching a computer to read English class!3. The Hands (Robotic Process Automation – RPA)
Once the Brain finds the important information (like “John Smith” and “$1000”), the Hands take over. Robotic Process Automation (RPA) in Insurance is a software robot that takes that info and types it into the company’s main computer system. It does the boring typing work so humans don’t have to.
Code Example: How OCR Reads a Document
Here’s a simple Python example showing how OCR extracts text from an image:
# Step 1: Import the OCR library
import pytesseract
from PIL import Image


# Step 2: Load the insurance form image
image = Image.open('insurance_claim.png')


# Step 3: Use OCR to extract text
text = pytesseract.image_to_string(image)


print("Extracted Text:")
print(text)
# Output: "Claimant Name: John Smith\nClaim Amount: $1000"
What’s happening? The OCR “sees” the image and turns it into text. But it doesn’t know what “John Smith” or “$1000” means yet!
3.5 How IDP Works: A Step-by-Step Journey
Let’s follow a real insurance form through the IDP process, like watching a package go through a factory!
Step 1: The Document Arrives
Mrs. Johnson’s car was hit by a tree. She takes a photo of the damage and fills out a claim form on her phone. She emails it to her insurance company. The form is messy—some parts are typed, some are handwritten, and the photo is a bit blurry.
Step 2: Pre-Processing (Cleaning Up)
Before reading, the AI cleans the image. It’s like when you erase smudges on your homework before turning it in.
The AI:- Straightens the crooked photo
- Makes the text sharper and clearer
- Removes shadows and stains
Step 3: Classification (Sorting)
The AI looks at the document and says, “This is a car insurance claim form, not a home insurance form.” It’s like sorting your school papers into different folders—math homework goes in the math folder!
Step 4: Extraction (Reading the Important Stuff)
Now the AI reads and finds:
• Name: Mrs. Johnson
• Policy Number: AUTO-12345
• Date of Accident: January 10, 2026
• Damage Amount: $2,500Step 5: Validation (Double-Checking)
The AI checks if everything makes sense:
✓ Is the policy number real? Yes!
✓ Is the date in the past (not the future)? Yes!
✓ Does the damage amount match the photo? Yes!Step 6: Human Review (Just in Case)
If the AI is 99% sure about everything, it processes the claim automatically. But if Mrs. Johnson’s handwriting is super messy and the AI is only 60% sure, it sends that part to a human to check. The human fixes it, and the AI learns for next time!
Step 7: Action Time!
The RPA “hands” take all this information and:
1. Update Mrs. Johnson’s file in the computer
2. Send her an email: “We got your claim!”
3. Schedule an inspector to look at her car
4. Start processing her paymentTotal time? About 2 minutes! Without IDP, this would take 2-3 days.
4. How Does This Help Us? (Use Cases)
So, why should we care? Because AI-driven solutions for insurance make life better for everyone in the USA.
Benefit 1: Fixing Things Faster (Claims)
Imagine a big hurricane hits Florida. Thousands of houses are damaged. Everyone calls their insurance company at the same time.
Without IDP: It takes months to read all the claims. People are stuck with holes in their roofs.
With IDP: The robots read the emails and forms instantly. They can help finish **Automated Claims Processing** in minutes! This means families get money to fix their homes much faster.Benefit 2: Buying Insurance is Easier (Underwriting)
When businesses buy insurance, they send huge files of information. It’s like sending a book report that is 500 words long.
IDP can read that “book report” in seconds and tell the insurance company, “This business is safe to insure.” This makes buying insurance quick and easy.Benefit 3: Following the Rules (Compliance)
In the USA, we have strict rules for insurance companies. There is a group called the **NAIC** (National Association of Insurance Commissioners) that acts like the Principal of a school. They make sure companies play fair.
Insurance document management systems help companies follow the rules. They keep a record of everything, so if the Principal checks, they can say, “Look, we did everything right!”4.5 Real-World Success Stories
Story 1: The Hurricane Helper
In 2024, Hurricane Zeta hit Louisiana. Over 50,000 homes were damaged. A big insurance company called “SafeHome Insurance” used IDP to process claims.
The Result: They processed 10,000 claims in the first week! Families got money to fix their roofs and windows super fast. Without IDP, it would have taken 3 months.Story 2: The Small Business Saver
A bakery owner named Mr. Lee wanted to insure his shop. He had to send 20 pages of documents—tax forms, building permits, and equipment lists. With old methods, it took 2 weeks to get approved.
With IDP: The AI read all 20 pages in 5 minutes. Mr. Lee got approved the same day and opened his bakery on time!Story 3: The Medical Mystery Solved
A worker named Sarah hurt her back at work. Her doctor wrote a 10-page medical report with lots of complicated words. The insurance company’s AI read the report and found the important parts:
• Injury type: Lower back strain
• Treatment needed: Physical therapy
• Time off work: 6 weeks
Sarah got her workers’ compensation approved in 24 hours instead of 3 weeks!5. Cool Apps in the USA (Insurtech)
There are new, cool companies in America called **Insurtechs**. They are like the “video game” version of insurance because they use so much tech.
- Lemonade: They have a chat-bot named “Jim.” You talk to Jim on your phone to file a claim. You don’t talk to a human! Jim uses AI to solve your problem in seconds.
- Root: They insure your car by looking at how you drive (using your phone’s sensors). They use data, not just paperwork, to give you a price.
- Hippo: They help protect homes using smart technology.
These companies are forcing the old, big companies (like State Farm or Geico) to use Digital Insurance USA tools too. Competition makes everyone better!
5.5 Challenges: It’s Not All Perfect
Even though IDP is amazing, it’s not perfect. Here are some challenges:
Challenge 1: Really Messy Handwriting
If a doctor writes like a chicken scratching in dirt, even the smartest AI might struggle! That’s why we still need humans to help sometimes.
Challenge 2: Privacy and Security
Insurance forms have personal information like your address, social security number, and medical history. Companies must keep this information super safe. They use encryption (like a secret code) to protect your data.
Challenge 3: Old Computer Systems
Some big insurance companies have computer systems that are 30 years old! It’s like trying to plug a new iPhone into a computer from 1995. The RPA “hands” help connect the new AI to these old systems, but it’s tricky.
Challenge 4: Teaching the AI
AI needs to learn from thousands of examples. If a company only has 10 examples of a rare form, the AI might not learn it well. It’s like trying to learn Spanish from only 10 words!
6. The Future: Even Smarter Robots!
Have you heard of ChatGPT? That is a type of “Generative AI.”
The future of Insurance automation solutions is using tools like that. Imagine a robot that can read a doctor’s messy handwritten note about a broken arm and perfectly understand it. That is happening right now!We are moving towards a world of “Hyper-automation.” That means the process is “Touchless.” You send a picture of your dented car, the AI looks at it, estimates the cost, and sends you money. No humans needed!
Code Example: How LLMs Understand and Extract Information
Here’s how a Large Language Model (LLM) like ChatGPT can read and interpret text:
# Step 1: Import the OpenAI library
import openai


# Step 2: The text extracted by OCR
ocr_text = "Claimant Name: John Smith. Claim Amount: $1000. Reason: Car accident on 01/10/2026."


# Step 3: Ask the LLM to extract structured data
response = openai.ChatCompletion.create(
    model="gpt-4",
    messages=[
        {"role": "system", "content": "You are an insurance document processor."},
        {"role": "user", "content": f"Extract the claimant name, amount, and reason from this text: {ocr_text}"}
    ]
)


# Step 4: Get the AI's answer
result = response['choices'][0]['message']['content']
print(result)
# Output: "Claimant: John Smith, Amount: $1000, Reason: Car accident"
What’s happening? The LLM doesn’t just see the words—it understands them! It knows “John Smith” is a person, “$1000” is money, and “Car accident” is the reason. This is the magic of AI in Insurance!
6.5 Comparing Old vs. New: The Big Difference
Task Old Way (Manual) New Way (IDP + AI) Reading a claim form 20 minutes per form 30 seconds per form Processing 1000 claims 2 weeks 1 day Accuracy (mistakes) 5-10% error rate 0.5% error rate Cost per document $3-5 $0.10-0.50 Works at night? No (people need sleep!) Yes (AI never sleeps!) The savings are huge! A medium-sized insurance company can save $5 million per year by using IDP!
7. Frequently Asked Questions (FAQs)
Q1: Will AI replace all insurance workers?
A: No! AI handles the boring, repetitive work (like typing data). This frees up humans to do the interesting stuff—like talking to customers, solving complex problems, and making important decisions. Think of it like calculators in math class. Calculators didn’t replace math teachers; they just made math faster!
Q2: Is my personal information safe with AI?
A: Yes! Insurance companies must follow strict laws like HIPAA (for medical info) and CCPA (in California). The AI systems use encryption and secure servers. It’s like keeping your diary in a locked safe that only you have the key to.
Q3: What if the AI makes a mistake?
A: There’s always a human checking the AI’s work, especially for big claims. If you get a claim denied and think it’s wrong, you can always ask a human to review it. The AI is a helper, not the final decision-maker.
Q4: Can I use IDP for my own documents?
A: Yes! There are apps like Adobe Scan and Microsoft Lens that use similar technology. You can scan your homework, receipts, or notes, and the app will turn them into text you can edit!
Q5: How long does it take to set up IDP?
A: For a big insurance company, it can take 6-12 months to fully set up. They need to train the AI on their specific forms and connect it to their computer systems. But once it’s running, it works 24/7!
Conclusion
So, the next time you see an insurance commercial, remember: it’s not just about boring paper anymore. It’s about smart robots, lasers (well, scanners), and super-fast computers working together.
By using Intelligent Document Processing (IDP) and Robotic Process Automation (RPA) in Insurance, companies are clearing that giant mountain of homework. They are turning paper into data, making things faster, cheaper, and better for all of us.
What Can You Do?
Even though you’re not running an insurance company (yet!), you can start learning about AI and automation:
- Learn to Code: Try learning Python (like the examples above) on websites like Code.org or Scratch.
- Explore AI Tools: Play with ChatGPT or Google Bard to see how AI understands language.
- Stay Curious: The future belongs to people who understand both technology AND people. Maybe you’ll be the one who invents the next big thing in insurance tech!
The world of Digital Insurance USA is growing fast. By 2030, experts predict that 80% of all insurance documents will be processed by AI. That’s a lot of homework being done by robots!
Remember: Technology is a tool to help humans, not replace them. The goal is to make insurance faster, fairer, and easier for everyone. And that’s something we can all be excited about!
-

Building OCR & Detection Systems with Deep Learning
Computer vision is revolutionizing industries by enabling machines to see and interpret the world. From OCR to real-time detection, AI-driven vision systems enhance security, automation, and efficiency.
OCR (Optical Character Recognition) converts scanned images or PDFs into readable text. With libraries like Tesseract or deep learning models (CRNNs), you can extract structured data from invoices, forms, or IDs.
Detection systems, using YOLO or SSD architectures, identify objects like people, cars, or tools in real-time video feeds. Retail stores use them for footfall analysis; factories for safety monitoring; banks for facial verification.
Building a vision system involves:
Collecting and annotating data
Training a model using TensorFlow or PyTorch
Optimizing it for edge deployment (e.g., Jetson Nano)
Deploying with Flask or FastAPI APIs
A real-world example is a parking solution that detects vacant spots via CCTV feeds, sends alerts, and optimizes flow.
Computer vision adds intelligence to cameras, turning raw footage into actionable data. Its applications are growing—from agriculture to eKYC—and the results are impressive.
-

Designing Scalable AWS Data Pipelines
Cloud-based data pipelines are essential for modern analytics and decision-making. AWS offers powerful tools like Glue, Redshift, and S3 to build pipelines that scale effortlessly with your business.
A data pipeline collects data from sources (e.g., APIs, logs, databases), transforms it, and stores it in a data warehouse. For instance, an e-commerce platform can use a pipeline to analyze customer behavior by ingesting clickstream data into Redshift for BI tools.
AWS Glue simplifies ETL (extract, transform, load) processes with visual workflows and job schedulers. Redshift serves as the destination for structured data, enabling fast queries and reports.
To build a pipeline:
Define your data sources.
Use AWS Glue to create crawler jobs that identify schema.
Schedule transformations using Glue Jobs (Python/Spark).
Store final data in Redshift or Athena for reporting.
Monitoring and alerting using CloudWatch ensures reliability. Secure the pipeline with IAM roles and encryption.
A scalable pipeline reduces manual data handling, supports real-time analytics, and ensures consistency across the organization. Whether it’s sales data, marketing funnels, or IoT logs—cloud pipelines are the backbone of data-driven success.
-

Unlock Insights with Real-Time KPI Dashboards
Key Performance Indicators (KPIs) are essential to track business progress. Real-time KPI dashboards help organizations monitor critical metrics and make data-driven decisions with confidence.
These dashboards integrate data from multiple sources—CRMs, ERPs, databases—and provide visual insights through tools like Power BI, Cube.js, and Flask dashboards. They answer questions like: Are we hitting our sales targets? What’s the customer churn this quarter? Where are costs spiking?
A well-designed dashboard simplifies decision-making. For example, a retail company might track daily sales, best-performing products, and low-stock alerts in real time. Managers can react instantly instead of waiting for end-of-month reports.
To build a dashboard, start with defining your key metrics. Next, use ETL pipelines to feed data into a central source. Tools like Power BI let you connect to these sources and create visuals—bar charts, gauges, maps—tailored to user needs.
Interactive features like filters and drill-downs make dashboards even more powerful. A sales head can view overall performance, then click to analyze regional trends or specific reps.
Real-time dashboards turn raw data into actionable knowledge. With proper governance and a good UX, they become the compass guiding business strategy.